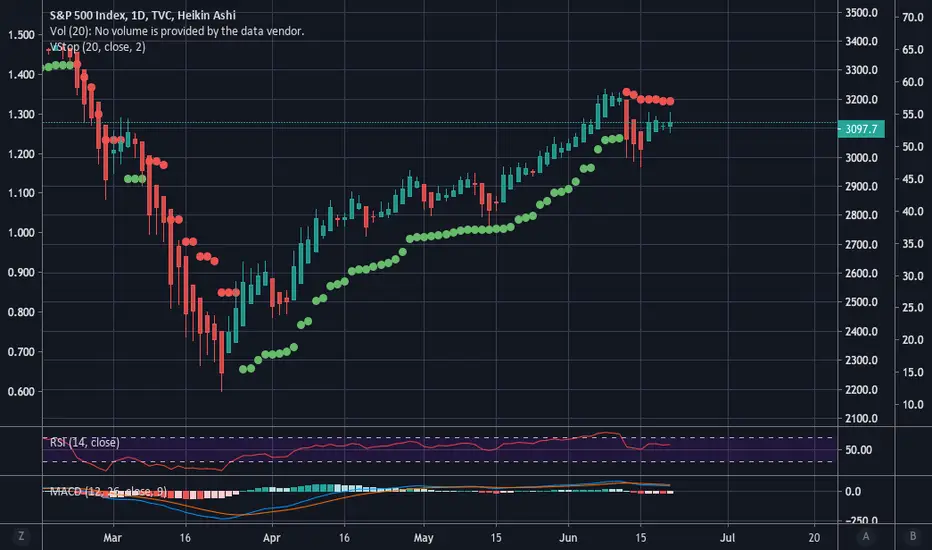
The daily chart using Heikin Ashi candles with volatility stops indicates that the trend changed to a downtrend last Thursday. A reasonable move back up would stop out these trending chart indicators, but they can be useful for longer-term trades. For instance, as you can see in the chart, had you traded off of these alone, you would have gone long on March 25th until last Thursday.
免責事項
これらの情報および投稿は、TradingViewが提供または保証する金融、投資、取引、またはその他の種類のアドバイスや推奨を意図したものではなく、またそのようなものでもありません。詳しくは利用規約をご覧ください。
免責事項
これらの情報および投稿は、TradingViewが提供または保証する金融、投資、取引、またはその他の種類のアドバイスや推奨を意図したものではなく、またそのようなものでもありません。詳しくは利用規約をご覧ください。