ロング
SPX: 2-Month timeframe signal will possibly trigger soon...
アップデート済

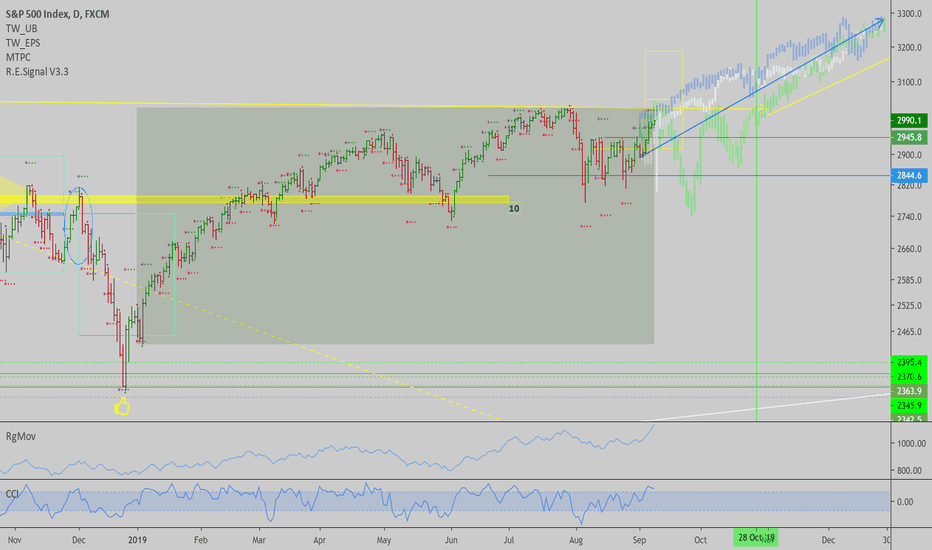
The long term trends that were triggered on Nov 2011, Jan 2013 and Nov 2016, plotted as an overlay to the current daily chart, paint a bullish picture for  SPX and our stocks portfolio as a whole. The long term chart is about to confirm a rally, like how it did back then on those 3 occasions. If it does, we will likely be higher by the end of the year, in the order of 13% higher for the index, give or take. Corrections along the way, could be 5 days long on average, and as much as 6.4% deep, but I don't think that will be the case, since volatility in 2011 was much higher than now, and currently distorting the average correction size significantly.
With dems having lower probability of being elected, and a trade deal being closer to becoming a reality, plus negative sentiment having peaked, with Gold and Bonds hitting long term tops possibly, and everyone absolutely hating stocks...I want to be long and let things pan out, same as we do with BTC for a while now.
Let's see how things evolve here, price action in the short term is constructive, with the daily targets show on chart (yellow boxes).
Best of luck,
Ivan Labrie.
With dems having lower probability of being elected, and a trade deal being closer to becoming a reality, plus negative sentiment having peaked, with Gold and Bonds hitting long term tops possibly, and everyone absolutely hating stocks...I want to be long and let things pan out, same as we do with
Let's see how things evolve here, price action in the short term is constructive, with the daily targets show on chart (yellow boxes).
Best of luck,
Ivan Labrie.
ノート
I'm heavily long stocks since last week, sold my ノート
Given general conditions, this signal might turn into a failure, I'd suggest taking a step back and holding cash, #BTC, #ETH, #Gold, #Silver, #Miners, be cautious with stock holdings. Liquidity wasn't enough to absorb supply, and the rally we had from support since last week is failing. Situation with China is getting worse, and Trump's position weakening...手動でトレードを終了しました
ノート
So far so good...Trend is up long term it seems, this may keep going until 2021, easily. Problem is finding buy entries on VIX spikes, and knowing when to hedge before corrections, but overall good to hold long term stock positions now.ノート
I copied the action from all the times a 2 month timeframe trend signal confirmed in SPX since 2009, and the average of those patterns was the blue arrow in my chart. You can see that it moved following my expected path overall:Stocks are a hold, direction is up, in the long term. Short term dislocations between now and mid to late 2021 will be buying opportunities. Watch the
ノート
Looks about right for a massive bottom...s3.amazonaws.com/tradingview/snapshots/p/PuAMIxSm.png
People reached peak bearishness, now RgExp from a mode. Mode retest held...
I think we got the bottom in stocks.
手動でトレードを終了しました
I sold the rally when 🔒Want to dive deeper? Check out my paid services below🔒
ivanlabrie.substack.com/
ivanlabrie.substack.com/
関連の投稿
免責事項
これらの情報および投稿は、TradingViewが提供または保証する金融、投資、取引、またはその他の種類のアドバイスや推奨を意図したものではなく、またそのようなものでもありません。詳しくは利用規約をご覧ください。
