SPY/ES Liquidity & Target Zones - Market Plan Overview
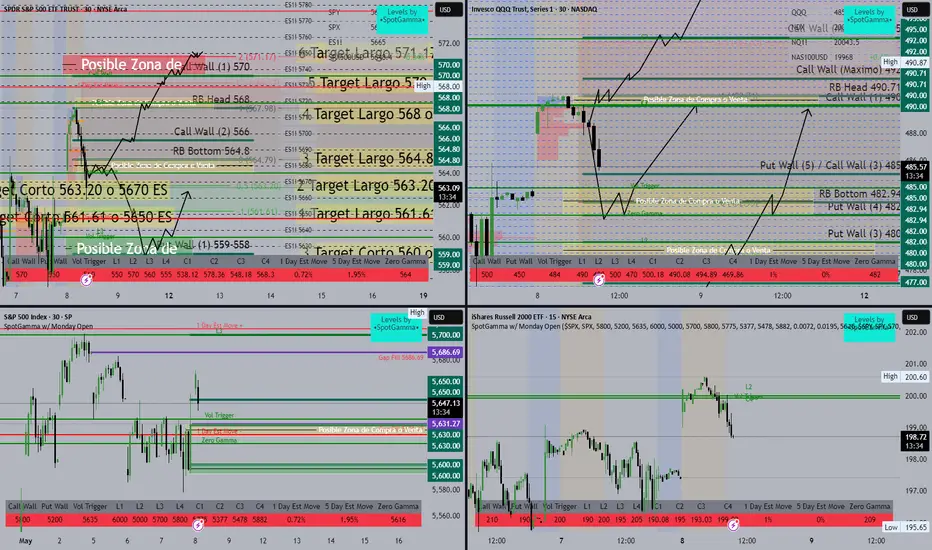
This visual map integrates liquidity levels, volume walls, and SpotGamma data to forecast key trading zones. Let's break it down in a structured format for better clarity and decision-making:
🔴 Possible Sell Zone / Final Target
Zone: Around 571.17 SPY or 5750 ES
Label: "Possible Sell or Final Target Zone"
Confluence: Call Wall (+1) at 579, significant resistance
🧠 This is a key exhaustion point for long positions. Ideal area to take profit or consider shorts.
✅ Upside Targets (Long Bias)
Target # SPY Level ES Equivalent Notes
6 571.17 5750 ES Extreme resistance zone
5 570 5740 ES Above Call Wall
4 568 5720 ES Matches liquidity cluster
3 564.8 5685 ES Near RB Bottom
2 563.20 5670 ES Mid-range pullback
1 561.61 5650 ES Close to mid gamma
🧠 These levels can be used for trailing targets or re-entries on pullbacks.
🔻 Downside Targets (Short Bias)
Target # SPY Level ES Equivalent Notes
1 563.20 5670 ES First major support
2 561.61 5650 ES Mid gamma support
3 560 5635 ES Near Zero Gamma and Put Wall
🧠 Breaks below these can trigger accelerated downside moves.
📈 Key Zones
Green Zone (Buy Zone):
559–558 SPY — Strong Put Wall and bounce probability area.
Yellow Zone (Flip Zone):
Around 564.79 SPY — Possible area of reversal, watch for reactions here.
Red Zone (Sell Zone):
Above 570 SPY — Watch for overextension and reversal signs.
🔍 Technical Tools Used
Call/Put Walls: Indicate dealer hedging areas and potential price magnets.
Volume Profile: Highlights high-activity price zones.
SpotGamma Levels: Used to identify gamma flip zones, walls, and trigger areas.
🔁 Possible Scenarios
Bullish Path:
Bounce from 561–563 range → Reclaim 564.8 → Push towards 568, possibly 570+.
Bearish Path:
Rejection at 564.8 or 568 → Breakdown below 561 → Test Put Wall at 559.
免責事項
これらの情報および投稿は、TradingViewが提供または保証する金融、投資、取引、またはその他の種類のアドバイスや推奨を意図したものではなく、またそのようなものでもありません。詳しくは利用規約をご覧ください。
免責事項
これらの情報および投稿は、TradingViewが提供または保証する金融、投資、取引、またはその他の種類のアドバイスや推奨を意図したものではなく、またそのようなものでもありません。詳しくは利用規約をご覧ください。