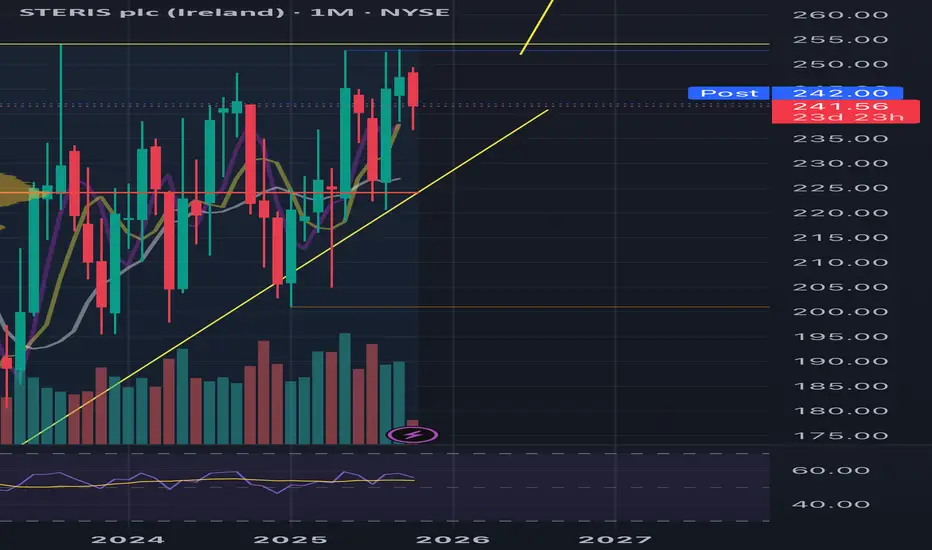
"STERIS plc (STE) monthly chart shows a classic bullish setup: after a strong long-term rally, the stock formed an ascending triangle pattern with rising lows and a strong resistance above. If  STE breaks out above resistance, the theoretical target—projecting the height of the pattern from the breakout zone—would be in the 335-350 range. Pattern confirmation and volume are key for trend continuation.
免責事項
これらの情報および投稿は、TradingViewが提供または保証する金融、投資、取引、またはその他の種類のアドバイスや推奨を意図したものではなく、またそのようなものでもありません。詳しくは利用規約をご覧ください。
免責事項
これらの情報および投稿は、TradingViewが提供または保証する金融、投資、取引、またはその他の種類のアドバイスや推奨を意図したものではなく、またそのようなものでもありません。詳しくは利用規約をご覧ください。