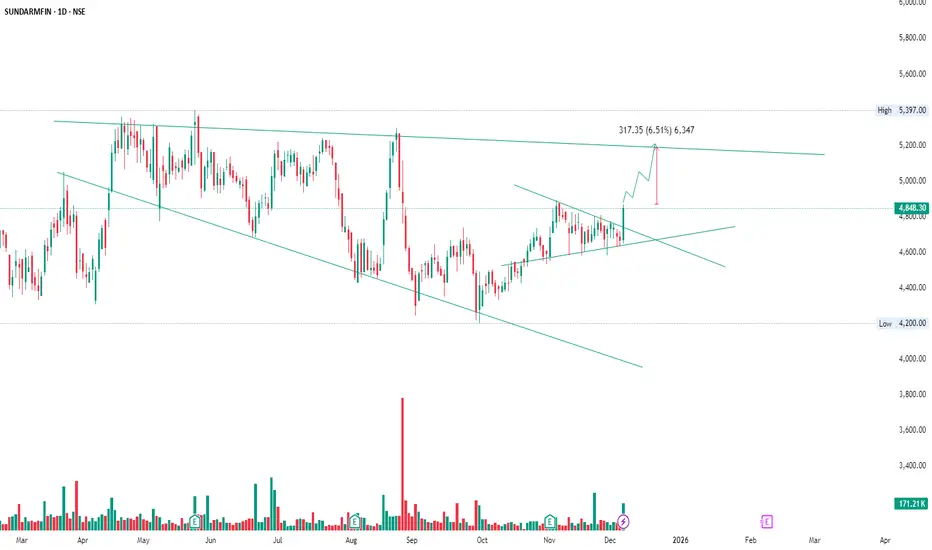
SUNDARMFIN has broken out of the falling wedge and is retesting the breakout zone successfully.
The structure drawn shows a bullish continuation setup:
Falling wedge breakout ✔️
Price holding above the retest zone ✔️
Momentum shifting higher ✔️
The upside projection points toward the major resistance trendline, with a measured target of ~6.5% from the breakout point.
Your drawing also highlights a profit-taking zone once price reaches the trendline resistance.
Trade Logic from the drawing:
Breakout → Retest → Continuation toward higher resistance
Possible reaction down after reaching the target line.
My Key View:
As long as price stays above the retest level,
bulls are in control toward the upper trendline.
SiripiVenu
免責事項
この情報および投稿は、TradingViewが提供または推奨する金融、投資、トレード、その他のアドバイスや推奨を意図するものではなく、それらを構成するものでもありません。詳細は利用規約をご覧ください。
SiripiVenu
免責事項
この情報および投稿は、TradingViewが提供または推奨する金融、投資、トレード、その他のアドバイスや推奨を意図するものではなく、それらを構成するものでもありません。詳細は利用規約をご覧ください。