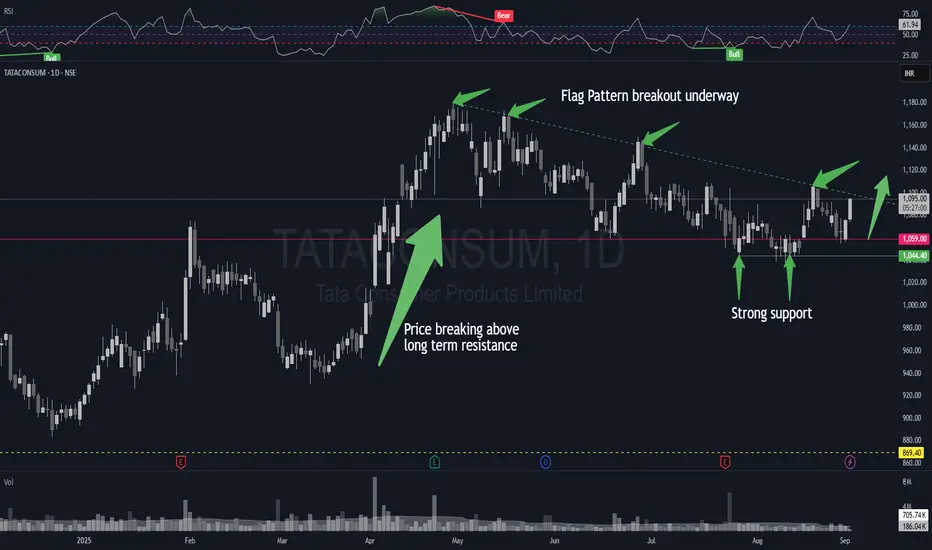
After breaking above a long-term resistance level near 1050 in April, the price consolidated above 1050 and formed a Flag Pattern. Bouncing from the support, showing positive momentum on RSI, and a bullish trend on MACD confirms the bullish view. After the breakout is complete, any pullback towards 9EMA or 21EMA may be used for entry, while keeping SL at 1030 on a daily closing basis.
Disclaimer: This idea is for educational and learning purposes only and not to be construed as a suggestion/advice to buy or sell any instrument. Please consult your investment advisor before making an investment. All the investments are subject to market risks.
Disclaimer: This idea is for educational and learning purposes only and not to be construed as a suggestion/advice to buy or sell any instrument. Please consult your investment advisor before making an investment. All the investments are subject to market risks.
免責事項
この情報および投稿は、TradingViewが提供または推奨する金融、投資、トレード、その他のアドバイスや推奨を意図するものではなく、それらを構成するものでもありません。詳細は利用規約をご覧ください。
免責事項
この情報および投稿は、TradingViewが提供または推奨する金融、投資、トレード、その他のアドバイスや推奨を意図するものではなく、それらを構成するものでもありません。詳細は利用規約をご覧ください。