🔍 Chart Analysis
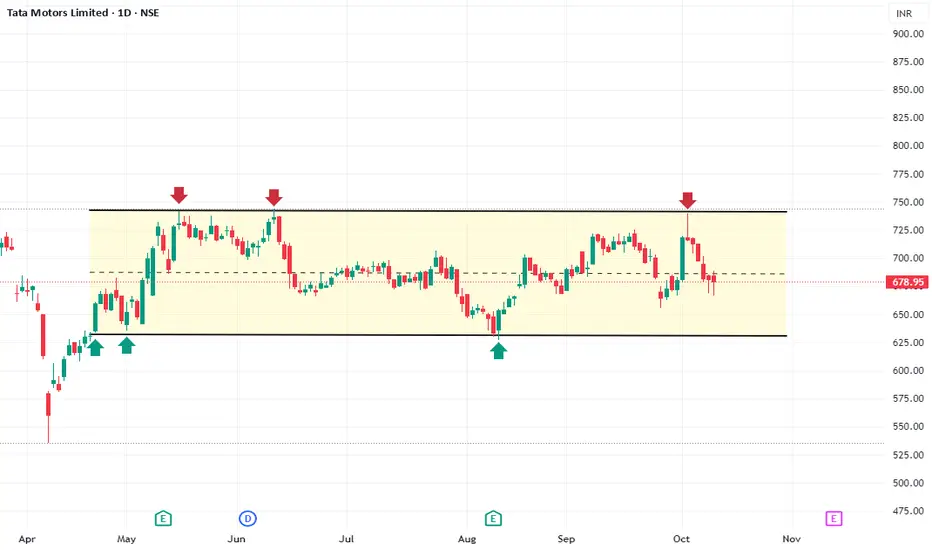
The chart for Tata Motors Ltd. (TATAMOTORS) on the Daily timeframe is showing a prolonged period of consolidation, forming a Rectangle Pattern. This pattern indicates that buyers and sellers are in a state of balance, trapping the price between two key horizontal levels.
Pattern: Rectangle / Horizontal Consolidation Range.
Timeframe: Daily.
Resistance (Supply Zone): The strong overhead resistance is approximately at the ₹740 - ₹750 zone. The price has been rejected from this level multiple times (indicated by the red arrows).
Support (Demand Zone): The solid base of support lies around the ₹630 - ₹640 zone. The price has bounced strongly from this level multiple times (indicated by the green arrows).
Current Position: The stock is currently trading near the midpoint of this range (around ₹678.95), which is a zone of indecision, making immediate trades riskier.
A significant price move, or a Market Structure Shift (MSS), will only be confirmed upon a decisive, high-volume breakout and close above the resistance or below the support.
📈 Trade Plan (Range Trading)
Given the current position within the range, the primary strategy is to trade the boundaries until a confirmed breakout occurs.
1. Bullish Scenario (Long Trade)
This is a counter-trend move within the range, trading off the support.
Entry: Look for a buy entry near the Support Zone of ₹630 - ₹640. Wait for clear bullish reversal signals (like a hammer, engulfing pattern, or double bottom on lower timeframes) at this level.
Stop Loss (SL): Place the stop loss a few points below the support zone, for example, around ₹620.
Target (T): Target the upper boundary/resistance zone at ₹740 - ₹750.
2. Bearish Scenario (Short Trade)
This is a counter-trend move within the range, trading off the resistance.
Entry: Look for a short entry near the Resistance Zone of ₹740 - ₹750. Wait for clear bearish reversal signals (like a shooting star, bearish engulfing pattern, or double top on lower timeframes) at this level.
Stop Loss (SL): Place the stop loss a few points above the resistance zone, for example, around ₹760.
Target (T): Target the lower boundary/support zone at ₹630 - ₹640.
🔑 Breakout Trade Plan (Trend Trade - MSS Confirmation)
The highest probability moves will be on a confirmed breakout from the rectangle, which would establish a new trend direction.
3. Confirmed MSS to the Upside (Trend Continuation)
Entry Condition: A decisive close and sustained trade (Daily close) ABOVE ₹750 on high volume. This will constitute the Market Structure Shift (MSS) to the upside.
Stop Loss (SL): Place the stop loss just inside the broken resistance zone (e.g., ₹730).
Target: The measured move target would be the height of the rectangle (₹750 - ₹630 = ₹120) projected upwards. Target = ₹870.
4. Confirmed MSS to the Downside (Trend Reversal/Continuation)
Entry Condition: A decisive close and sustained trade (Daily close) BELOW ₹630 on high volume. This will constitute the Market Structure Shift (MSS) to the downside.
Stop Loss (SL): Place the stop loss just inside the broken support zone (e.g., ₹650).
Target: The measured move target would be the height of the rectangle (₹120) projected downwards. Target = ₹510.
免責事項
この情報および投稿は、TradingViewが提供または推奨する金融、投資、トレード、その他のアドバイスや推奨を意図するものではなく、それらを構成するものでもありません。詳細は利用規約をご覧ください。
免責事項
この情報および投稿は、TradingViewが提供または推奨する金融、投資、トレード、その他のアドバイスや推奨を意図するものではなく、それらを構成するものでもありません。詳細は利用規約をご覧ください。