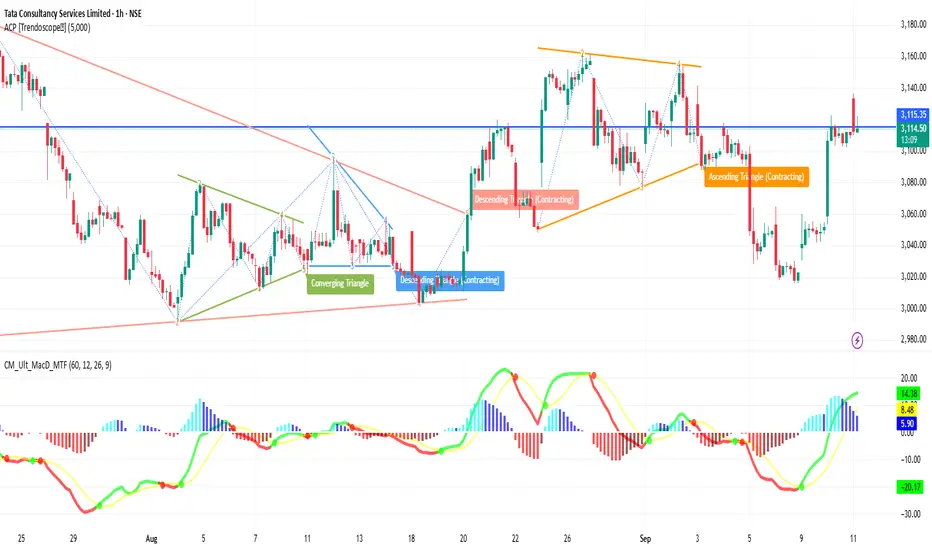
TCS 1-Hour Snapshot
Price is around ₹3,110
Showing small gains in recent sessions
Has been under pressure from broader IT sector weakness, but holding above some short-term support
🔎 Technical Indicators & Trend
Moving Averages (short-term hourly) are slightly below current price → providing support
Medium-term MAs (50-hour etc.) are above → resistance overhead
RSI (hourly) is moderately neutral—neither strongly overbought nor oversold
Trend strength appears modest; no sharp momentum bars or volume spikes indicating breakout
🔧 Support & Resistance Levels (1H)
Support: ~₹3,080–₹3,090 first support zone
Resistance: ~₹3,130–₹3,140 nearby resistance
🧭 Short-Term Outlook
Bullish Case: A break above ~₹3,130-3,140 with volume could push toward ~₹3,160
Bearish Case: If it fails to break resistance and drops below ~₹3,090, possible move toward ~₹3,060
Overall Bias: Slightly bullish to neutral; waiting for confirmation from resistance breakout
関連の投稿
免責事項
この情報および投稿は、TradingViewが提供または推奨する金融、投資、トレード、その他のアドバイスや推奨を意図するものではなく、それらを構成するものでもありません。詳細は利用規約をご覧ください。
免責事項
この情報および投稿は、TradingViewが提供または推奨する金融、投資、トレード、その他のアドバイスや推奨を意図するものではなく、それらを構成するものでもありません。詳細は利用規約をご覧ください。