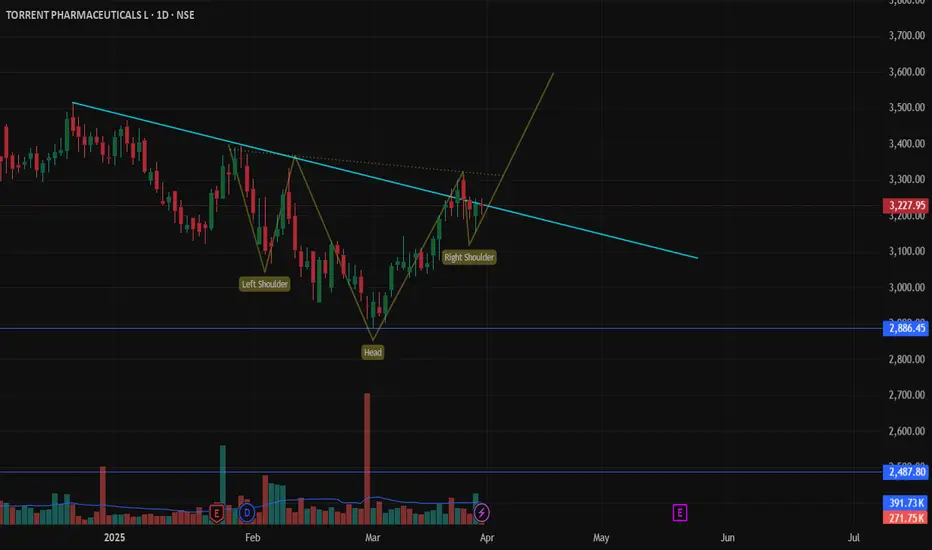
Inverse H&S Forming on Daily TF – Price Testing Resistance Trendline. What’s Next?
An Inverse Head & Shoulders (H&S) pattern is taking shape on the daily chart, suggesting a potential bullish reversal. Price is now testing a key resistance trendline—will it break through?
🔹 Bullish Confirmation: A breakout above resistance could confirm the pattern, targeting higher levels.
🔹 Bearish Rejection: If price gets rejected, the setup may fail, leading to a retest of nearest support.
Key Levels: Neckline (resistance) & trendline breakout zone. Thoughts? #PriceAction #TradingSetup
免責事項
この情報および投稿は、TradingViewが提供または推奨する金融、投資、トレード、その他のアドバイスや推奨を意図するものではなく、それらを構成するものでもありません。詳細は利用規約をご覧ください。
免責事項
この情報および投稿は、TradingViewが提供または推奨する金融、投資、トレード、その他のアドバイスや推奨を意図するものではなく、それらを構成するものでもありません。詳細は利用規約をご覧ください。