1. Market Structure Overview
1.1 Previous High Sweep (Fakeout) – ~357.41
Price made a strong push above previous highs but was sharply rejected.
Indicates potential liquidity grab and institutional selling.
1.2 Change of Character (CHoCH) – ~333
Price broke below the previous higher low structure, signaling the end of bullish momentum.
Marks a bearish shift after an extended uptrend.
1.3 Break of Structure (BOS) – ~317
Confirms bearish continuation after CHoCH.
Price closed below support, validating the downtrend.
2. Supply & Demand Zones
2.1 Supply Zones (Resistance)
Zone A (343–357)
Major Supply from the last distribution before the drop.
High volume selling occurred; strong resistance expected.
Zone B (328–336)
Local Supply formed after CHoCH.
Price may react here before testing higher levels.
2.2 Demand Zones (Support)
Zone C (315–319)
Price bounced from here twice; active buyer interest.
Critical zone for near-term bullish continuation.
Zone D (299–306)
Strong Demand and origin of the last large impulse up.
Institutional footprints likely; strong support if retested.
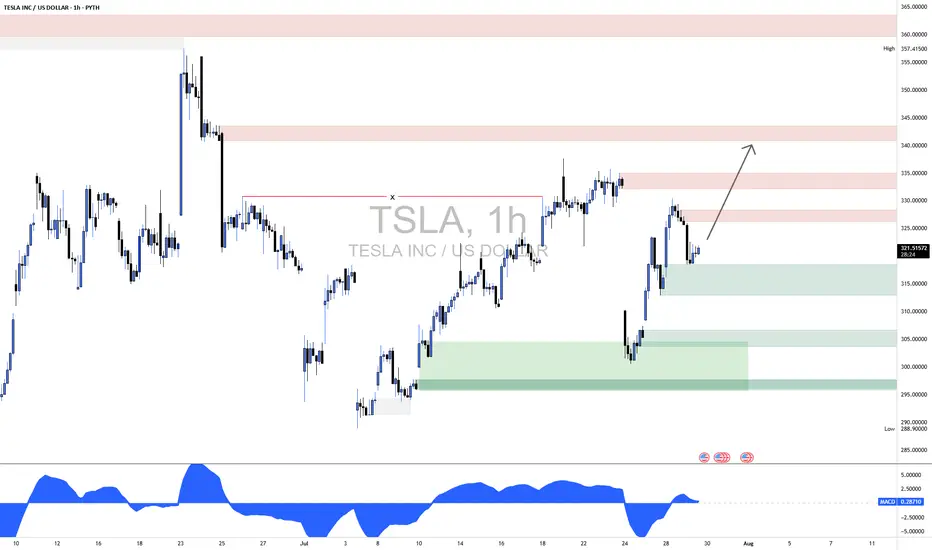
3. Price Action Analysis (Inside Bordered Region)
Current Price (~321.68) is rebounding from Zone C.
Price is forming higher lows intraday, showing bullish intent.
Expected Move:
Short-term bounce toward Zone B (328–336).
If sellers overpower, potential reversal from this supply.
If buyers maintain momentum and break above Zone B, move toward Zone A (343–357) is likely.
4. Momentum & Confirmation
MACD on the 1-hour shows a bullish crossover, suggesting short-term buying pressure.
Structure remains bearish to neutral unless price closes above 336.
A break and hold above 336 would shift bias back to bullish continuation.
5. Financial Context Supporting Price Zones
Recent Tesla Catalysts (July 2025):
Earnings Reported July 24: Mixed results. Strong delivery numbers but concerns about margins due to price cuts.
Investor Sentiment: Divided. Some bullish based on long-term EV growth; others cautious due to margin compression.
Macroeconomic Factors:
Fed policy indecision is increasing volatility.
Tech-heavy indexes (like Nasdaq) are pulling back slightly, causing large-cap techs to see choppy moves.
These events support the supply zone near 328–336 acting as resistance until new bullish data or technical breakouts occur.
1.1 Previous High Sweep (Fakeout) – ~357.41
Price made a strong push above previous highs but was sharply rejected.
Indicates potential liquidity grab and institutional selling.
1.2 Change of Character (CHoCH) – ~333
Price broke below the previous higher low structure, signaling the end of bullish momentum.
Marks a bearish shift after an extended uptrend.
1.3 Break of Structure (BOS) – ~317
Confirms bearish continuation after CHoCH.
Price closed below support, validating the downtrend.
2. Supply & Demand Zones
2.1 Supply Zones (Resistance)
Zone A (343–357)
Major Supply from the last distribution before the drop.
High volume selling occurred; strong resistance expected.
Zone B (328–336)
Local Supply formed after CHoCH.
Price may react here before testing higher levels.
2.2 Demand Zones (Support)
Zone C (315–319)
Price bounced from here twice; active buyer interest.
Critical zone for near-term bullish continuation.
Zone D (299–306)
Strong Demand and origin of the last large impulse up.
Institutional footprints likely; strong support if retested.
3. Price Action Analysis (Inside Bordered Region)
Current Price (~321.68) is rebounding from Zone C.
Price is forming higher lows intraday, showing bullish intent.
Expected Move:
Short-term bounce toward Zone B (328–336).
If sellers overpower, potential reversal from this supply.
If buyers maintain momentum and break above Zone B, move toward Zone A (343–357) is likely.
4. Momentum & Confirmation
MACD on the 1-hour shows a bullish crossover, suggesting short-term buying pressure.
Structure remains bearish to neutral unless price closes above 336.
A break and hold above 336 would shift bias back to bullish continuation.
5. Financial Context Supporting Price Zones
Recent Tesla Catalysts (July 2025):
Earnings Reported July 24: Mixed results. Strong delivery numbers but concerns about margins due to price cuts.
Investor Sentiment: Divided. Some bullish based on long-term EV growth; others cautious due to margin compression.
Macroeconomic Factors:
Fed policy indecision is increasing volatility.
Tech-heavy indexes (like Nasdaq) are pulling back slightly, causing large-cap techs to see choppy moves.
These events support the supply zone near 328–336 acting as resistance until new bullish data or technical breakouts occur.
Looking for powerful AI trading signals? Visit ProSignal.ai and take your trading to the next level! or join our telegram channel at t.me/prosignalai
免責事項
これらの情報および投稿は、TradingViewが提供または保証する金融、投資、取引、またはその他の種類のアドバイスや推奨を意図したものではなく、またそのようなものでもありません。詳しくは利用規約をご覧ください。
Looking for powerful AI trading signals? Visit ProSignal.ai and take your trading to the next level! or join our telegram channel at t.me/prosignalai
免責事項
これらの情報および投稿は、TradingViewが提供または保証する金融、投資、取引、またはその他の種類のアドバイスや推奨を意図したものではなく、またそのようなものでもありません。詳しくは利用規約をご覧ください。