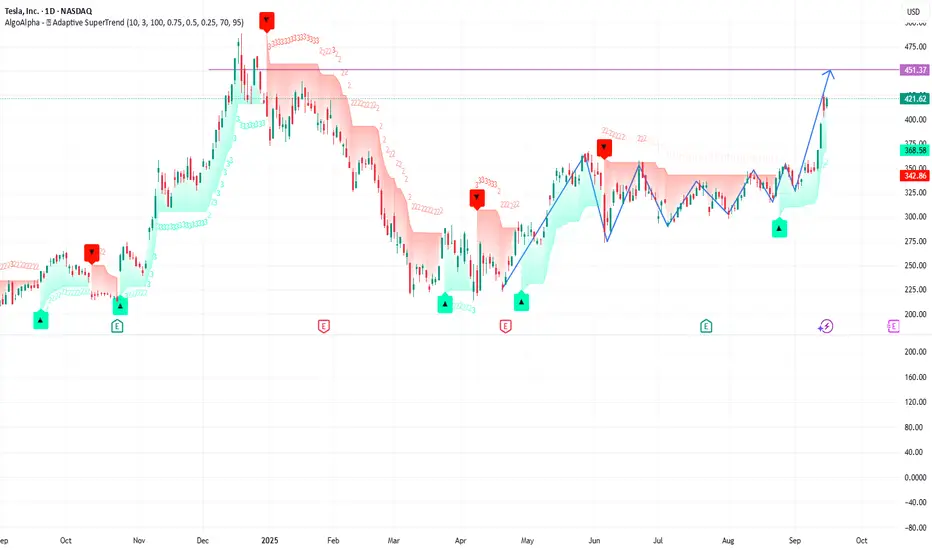
I think TSLA is moving up
The 1D timeframe show us how it was on a range and a few days ago started to go up
Next lvl should be 450, but also can go to 480
What do you think?
Bullish or bearish?
Do you see the bull flag?
Also the size and shape of candles remember me to a bullish movement.
When you see candlesticks all the day, everyday, you can see a pattern!
Lol
免責事項
この情報および投稿は、TradingViewが提供または推奨する金融、投資、トレード、その他のアドバイスや推奨を意図するものではなく、それらを構成するものでもありません。詳細は利用規約をご覧ください。
免責事項
この情報および投稿は、TradingViewが提供または推奨する金融、投資、トレード、その他のアドバイスや推奨を意図するものではなく、それらを構成するものでもありません。詳細は利用規約をご覧ください。