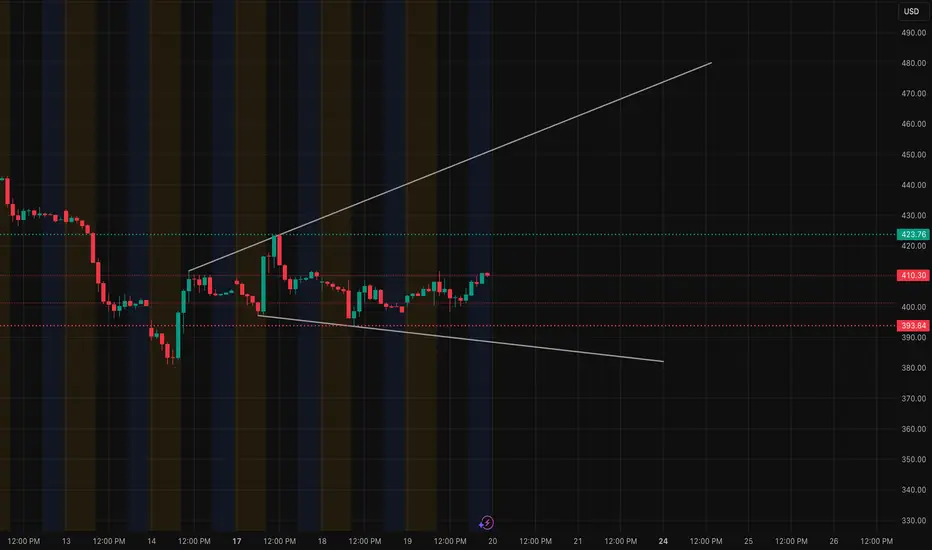
TSLA is coiling inside a clean rising wedge on the 1H and 15M charts. Price is grinding toward the apex with buyers slowly stepping in, but sellers are still defending the 410–415 zone. This tension usually leads to a breakout move, up or down, depending on how the opening momentum comes in.
Tomorrow, traders will be watching TSLA because it’s sitting right at the intersection of trendline pressure + GEX walls — perfect setup for volatility.
1. 1H Timeframe – Bigger Picture
* TSLA is trapped between 395 support and 410–415 resistance.
* The rising wedge support is doing its job. Every dip into 395–398 gets bought.
* If TSLA clears 415, it can quickly push toward 422–425, then 430.
* If it rejects again, the wedge breaks down toward 400, then 390.
What matters: This structure is tight. A move outside the wedge tomorrow will set direction for the next 2–3 sessions.
2. 15M Timeframe – Intraday Setup

* Strong BOS + CHoCH stack that reversed the downtrend earlier today.
* Price is now retesting the mid-range around 410.
* Bears are active at 410.30–411.50 (multiple rejections).
* Bulls defending the 401–402 block and 398–400 FVG zone.
If buyers hold 401–402: TSLA can attempt 415 → 422.
If sellers break 398: Expect a fast unwind toward 390–392.
The 15M gives the intraday trigger for the bigger 1H structure.
3. GEX / Options Sentiment – Confirms the Levels

This is the clean part:
* Highest positive GEX resistance at 422–425. Options dealers hedge aggressively there → hard ceiling unless volume comes in.
* 410 is the HVL zone — right where price is stuck. This level often acts like a magnet and chop zone.
* Below price, 400 / 395 / 390 are stacked with negative GEX → this acts like put support. Traders love to take premium here.
What this means: GEX supports the same ranges the chart shows:
* Above 415 → clear air pockets toward 422–425.
* Below 400 → air pocket toward 390.
Trading Outlook for Nov 20
Bullish Scenario
* Needs to reclaim 415 with strength.
* First target: 422
* Next target: 425–430
* Momentum confirmation: volume spike + 15M BOS continuation.
Bearish Scenario
* Lose 398–400, preferably on a breakdown during first 15–30 minutes.
* Target: 390–392
* Next: 382 (deep range sweep)
Neutral / Range
* If price sits between 402–410, expect chop.
* This is where most retail gets trapped.
Probability Summary (Not Signals)
* Breakout above 415: moderate probability if NASDAQ is strong.
* Reject & fade into 400: high probability if SPY pulls back.
* Chop 402–410: base case until macro gives direction.
Final Note
Everything lines up cleanly across 1H, 15M, and GEX — the exact setup traders search for before a trend day. TSLA will be heavily watched tomorrow because whichever side wins this 410 battle will control the next big move.
Tomorrow, traders will be watching TSLA because it’s sitting right at the intersection of trendline pressure + GEX walls — perfect setup for volatility.
1. 1H Timeframe – Bigger Picture
* TSLA is trapped between 395 support and 410–415 resistance.
* The rising wedge support is doing its job. Every dip into 395–398 gets bought.
* If TSLA clears 415, it can quickly push toward 422–425, then 430.
* If it rejects again, the wedge breaks down toward 400, then 390.
What matters: This structure is tight. A move outside the wedge tomorrow will set direction for the next 2–3 sessions.
2. 15M Timeframe – Intraday Setup
* Strong BOS + CHoCH stack that reversed the downtrend earlier today.
* Price is now retesting the mid-range around 410.
* Bears are active at 410.30–411.50 (multiple rejections).
* Bulls defending the 401–402 block and 398–400 FVG zone.
If buyers hold 401–402: TSLA can attempt 415 → 422.
If sellers break 398: Expect a fast unwind toward 390–392.
The 15M gives the intraday trigger for the bigger 1H structure.
3. GEX / Options Sentiment – Confirms the Levels
This is the clean part:
* Highest positive GEX resistance at 422–425. Options dealers hedge aggressively there → hard ceiling unless volume comes in.
* 410 is the HVL zone — right where price is stuck. This level often acts like a magnet and chop zone.
* Below price, 400 / 395 / 390 are stacked with negative GEX → this acts like put support. Traders love to take premium here.
What this means: GEX supports the same ranges the chart shows:
* Above 415 → clear air pockets toward 422–425.
* Below 400 → air pocket toward 390.
Trading Outlook for Nov 20
Bullish Scenario
* Needs to reclaim 415 with strength.
* First target: 422
* Next target: 425–430
* Momentum confirmation: volume spike + 15M BOS continuation.
Bearish Scenario
* Lose 398–400, preferably on a breakdown during first 15–30 minutes.
* Target: 390–392
* Next: 382 (deep range sweep)
Neutral / Range
* If price sits between 402–410, expect chop.
* This is where most retail gets trapped.
Probability Summary (Not Signals)
* Breakout above 415: moderate probability if NASDAQ is strong.
* Reject & fade into 400: high probability if SPY pulls back.
* Chop 402–410: base case until macro gives direction.
Final Note
Everything lines up cleanly across 1H, 15M, and GEX — the exact setup traders search for before a trend day. TSLA will be heavily watched tomorrow because whichever side wins this 410 battle will control the next big move.
免責事項
この情報および投稿は、TradingViewが提供または推奨する金融、投資、トレード、その他のアドバイスや推奨を意図するものではなく、それらを構成するものでもありません。詳細は利用規約をご覧ください。
免責事項
この情報および投稿は、TradingViewが提供または推奨する金融、投資、トレード、その他のアドバイスや推奨を意図するものではなく、それらを構成するものでもありません。詳細は利用規約をご覧ください。