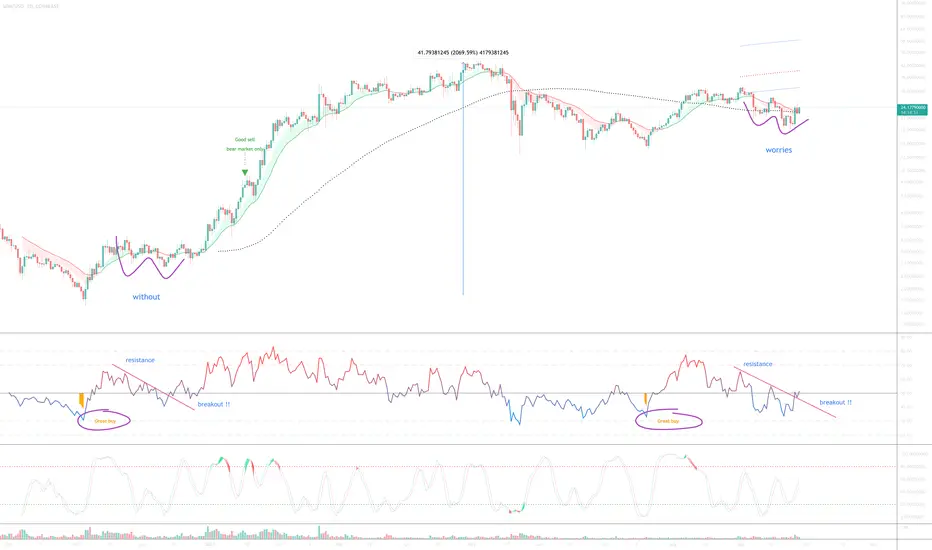
The last time a ‘great buy’ signal flashed on price action (during a bull market) (purple circles) price action moved up 2000%. Not saying that’s going to happened again. However we do have a fractal.
1) RSI resistance break out.
2) ‘W’ formation in price action printing a new higher low.
3) The new higher low prints on the golden ratio just as before.
4) Price action moves above the dotted line. Anyone know what it is? It is not a moving average!
5) Lastly, look at the weekly chart below. I’ve scanned all alt coins traded on Binance / Coinbase.. No other alt token is printing / closed with a Dragonfly DOJI candle on the weekly of this magnitude. This is huge buying pressure at play. (it is also printing on 10-day chart).
1st target $160
Good luck!
WW
Weekly chart
トレード稼働中
Not 1, not 2, 3..4..5 no 8 oscillators are printing bullish divergence with price action. That's amazing. This is all happening as price action just tested the annual EMA (little green line - now have enough data to show this EMA!).ノート
Expect a move to $30 soonish.トレード終了: ストップロスに到達
Got to pull the plug on this one, sorry. Two important events in price action cannot by ignored:1) Death cross on the 2-day chart.
2) Price action prints a lower low breaking market structure.
Look elsewhere, there's better opportunities out there (see recent ideas) and there's a few more to come...
免責事項
これらの情報および投稿は、TradingViewが提供または保証する金融、投資、取引、またはその他の種類のアドバイスや推奨を意図したものではなく、またそのようなものでもありません。詳しくは利用規約をご覧ください。
免責事項
これらの情報および投稿は、TradingViewが提供または保証する金融、投資、取引、またはその他の種類のアドバイスや推奨を意図したものではなく、またそのようなものでもありません。詳しくは利用規約をご覧ください。