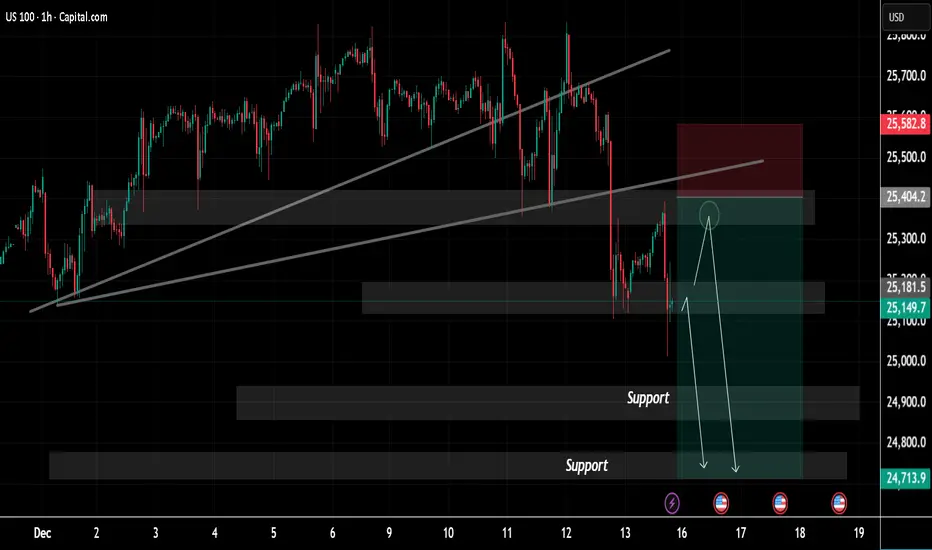
US100 on the 1-hour timeframe, highlighting a shift in market structure from bullish to bearish Price was previously moving within an ascending channel, respecting higher highs and higher low a strong bearish breakdown occurred, with price decisively breaking below the rising trendline, indicating a loss of bullish momentum the sharp sell-off suggests institutional distribution and a potential trend reversal.
Resistance Zone (≈ 25,400 – 25,580)
Immediate Support (≈ 25,150 – 25,200)
These are marked demand/support areas and are likely downside targets if bearish momentum continues we could see support 24,900 to 24,700
The projected arrows indicate a possible retracement toward resistance, followed by continuation to the downside as long as price remains below the broken trendline and resistance zone, the bearish bias remains valid buyers appear weak, while sellers maintain control.
If you find it helpful please like and comments for this post and share thanks.
トレード稼働中
1st Target reached
✅FREE FOREX Signals in Telegram
t.me/thedollarpipskiller
✅ Suggest News Channel
t.me/addlist/5h3Y2WG2eyVkOTY0
t.me/thedollarpipskiller
✅ Suggest News Channel
t.me/addlist/5h3Y2WG2eyVkOTY0
関連の投稿
免責事項
この情報および投稿は、TradingViewが提供または推奨する金融、投資、トレード、その他のアドバイスや推奨を意図するものではなく、それらを構成するものでもありません。詳細は利用規約をご覧ください。
✅FREE FOREX Signals in Telegram
t.me/thedollarpipskiller
✅ Suggest News Channel
t.me/addlist/5h3Y2WG2eyVkOTY0
t.me/thedollarpipskiller
✅ Suggest News Channel
t.me/addlist/5h3Y2WG2eyVkOTY0
関連の投稿
免責事項
この情報および投稿は、TradingViewが提供または推奨する金融、投資、トレード、その他のアドバイスや推奨を意図するものではなく、それらを構成するものでもありません。詳細は利用規約をご覧ください。