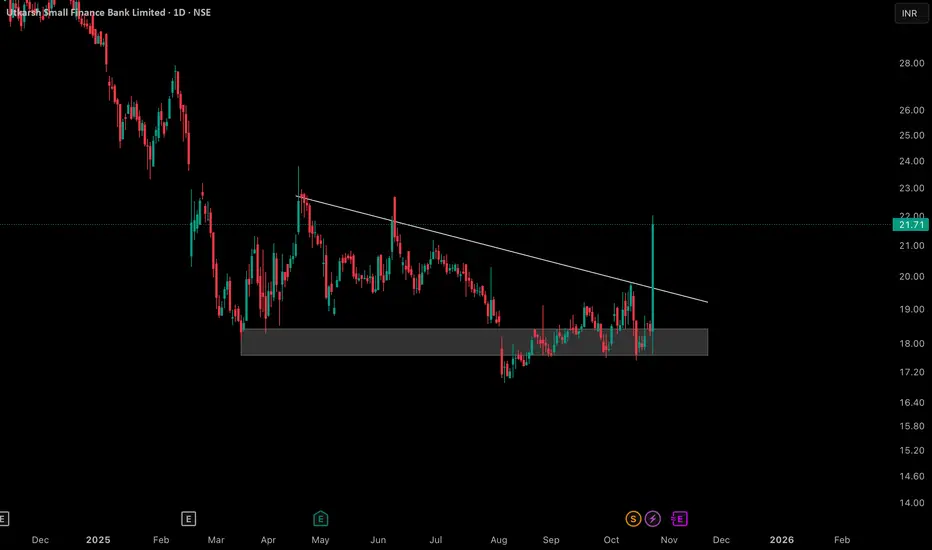
The daily chart for Utkarsh Small Finance Bank Limited displays a well-defined descending triangle, marked by a consistent supply trendline and an established horizontal support zone. During the recent price action, there was a temporary dip below the support, which was quickly retraced as price action returned within the range and formed a distinct lower wick rejection candle at the base.
This chart highlights the role of false moves and re-entries within important technical zones, as well as the reaction to a descending trendline. No trading advice or forecast is implied—this is for educational and analytical purposes, providing an example of how certain classical patterns and market behaviors may unfold within price structure.
This chart highlights the role of false moves and re-entries within important technical zones, as well as the reaction to a descending trendline. No trading advice or forecast is implied—this is for educational and analytical purposes, providing an example of how certain classical patterns and market behaviors may unfold within price structure.
🎯 Master My Self-Made Trading Strategy
📈 Telegram (Learn Today): t.me/hashtaghammer
✅ WhatsApp (Learn Today): wa.me/919455664601
📈 Telegram (Learn Today): t.me/hashtaghammer
✅ WhatsApp (Learn Today): wa.me/919455664601
関連の投稿
免責事項
この情報および投稿は、TradingViewが提供または推奨する金融、投資、トレード、その他のアドバイスや推奨を意図するものではなく、それらを構成するものでもありません。詳細は利用規約をご覧ください。