This trading plan combines Elliott Wave analysis with Fibonacci retracement and extension levels, focusing on key psychological points to guide entry, exit, and risk management decisions for the Gold/USD 1-hour chart.
Fibonacci Levels & Psychological Zones:
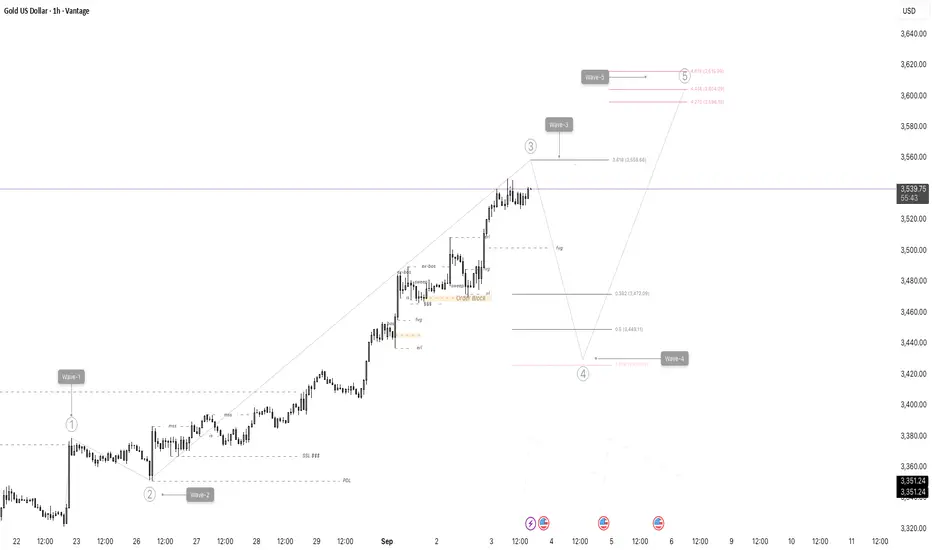
Wave 3 is approaching a Fibonacci extension zone near 3,558 - 3,616 (from 3.618 to 4.618 levels). This acts as a key resistance and potential Wave 3 target.
The retracement for Wave 4 correction is expected to land within the important Fibonacci retracement zones:
- 38.2% (~3,472)
- 50% (~3,449)
- 61.8% (~3,426)
These Fibonacci levels serve as psychological support zones where Wave 4 could end and Wave 5 might begin.
Fibonacci Levels & Psychological Zones:
Wave 3 is approaching a Fibonacci extension zone near 3,558 - 3,616 (from 3.618 to 4.618 levels). This acts as a key resistance and potential Wave 3 target.
The retracement for Wave 4 correction is expected to land within the important Fibonacci retracement zones:
- 38.2% (~3,472)
- 50% (~3,449)
- 61.8% (~3,426)
These Fibonacci levels serve as psychological support zones where Wave 4 could end and Wave 5 might begin.
関連の投稿
免責事項
これらの情報および投稿は、TradingViewが提供または保証する金融、投資、取引、またはその他の種類のアドバイスや推奨を意図したものではなく、またそのようなものでもありません。詳しくは利用規約をご覧ください。
免責事項
これらの情報および投稿は、TradingViewが提供または保証する金融、投資、取引、またはその他の種類のアドバイスや推奨を意図したものではなく、またそのようなものでもありません。詳しくは利用規約をご覧ください。