Lesson Focus: Candlestick Types (Practice)
This post is a practical continuation of the previous candlestick theory lesson.
If you have not reviewed the previous theoretical lesson, it is recommended to do so first, as this chart directly builds upon those concepts.
Here, candlestick concepts are shown directly on a real price chart to illustrate how they appear within live market structure.
📘 PURPOSE OF THIS CHART
The goal of this chart is to visually connect theory with practice by identifying candlestick behaviors explained in the previous lesson.
No trading signals are given.
No entries, exits, or predictions are suggested.
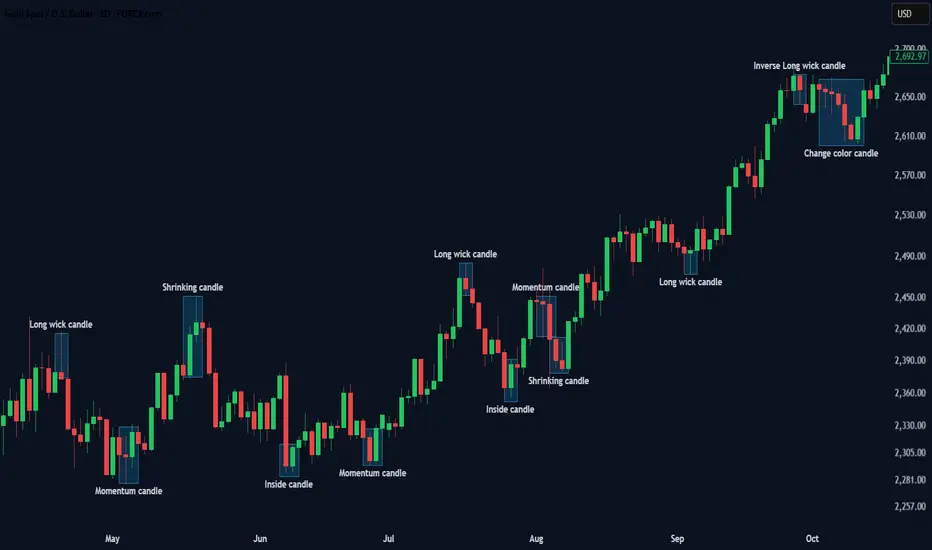
🧠 CANDLESTICK BEHAVIORS SHOWN ON THE CHART
• Long Wick Candle
Shows price rejection, where the market attempted to move further but was pushed back.
• Inverse Long Wick Candle
Represents acceptance in the direction of the prevailing trend and rejection on the opposite side.
• Shrinking Candle
Indicates loss of momentum as price continues with reduced strength.
• Momentum Candle
Represents a sudden imbalance where one side temporarily dominates price movement.
• Inside Candle
Forms completely within the range of the previous candle, signaling consolidation and indecision.
• Change Color Candle
Reflects weakening pressure or a pause in the current directional move.
📌 KEY REMINDER
Candlesticks do not move price.
They reflect past decisions made by buyers and sellers.
Their meaning becomes clearer only when viewed within:
• market context
• market structure
• surrounding price behavior
This lesson is part of an ongoing educational market structure series.
If you find value in this approach, you may follow to stay connected with the upcoming lessons where concepts are built step by step.
ETHICAL & EDUCATIONAL NOTICE
This content is presented solely for educational and analytical purposes, based on historical price data.
It does not promote or encourage any specific trading method, financial instrument, gambling, leverage, margin usage, short selling, or interest-based activity.
Readers are encouraged to align any financial activity with their own ethical, legal, and religious principles.
⚠️ DISCLAIMER
This material is strictly educational and informational.
It does not constitute financial advice, investment recommendations, or trading instructions.
The author does not provide personalized guidance.
Any decisions made based on this content are the sole responsibility of the individual.
This post is a practical continuation of the previous candlestick theory lesson.
If you have not reviewed the previous theoretical lesson, it is recommended to do so first, as this chart directly builds upon those concepts.
Here, candlestick concepts are shown directly on a real price chart to illustrate how they appear within live market structure.
📘 PURPOSE OF THIS CHART
The goal of this chart is to visually connect theory with practice by identifying candlestick behaviors explained in the previous lesson.
No trading signals are given.
No entries, exits, or predictions are suggested.
🧠 CANDLESTICK BEHAVIORS SHOWN ON THE CHART
• Long Wick Candle
Shows price rejection, where the market attempted to move further but was pushed back.
• Inverse Long Wick Candle
Represents acceptance in the direction of the prevailing trend and rejection on the opposite side.
• Shrinking Candle
Indicates loss of momentum as price continues with reduced strength.
• Momentum Candle
Represents a sudden imbalance where one side temporarily dominates price movement.
• Inside Candle
Forms completely within the range of the previous candle, signaling consolidation and indecision.
• Change Color Candle
Reflects weakening pressure or a pause in the current directional move.
📌 KEY REMINDER
Candlesticks do not move price.
They reflect past decisions made by buyers and sellers.
Their meaning becomes clearer only when viewed within:
• market context
• market structure
• surrounding price behavior
This lesson is part of an ongoing educational market structure series.
If you find value in this approach, you may follow to stay connected with the upcoming lessons where concepts are built step by step.
ETHICAL & EDUCATIONAL NOTICE
This content is presented solely for educational and analytical purposes, based on historical price data.
It does not promote or encourage any specific trading method, financial instrument, gambling, leverage, margin usage, short selling, or interest-based activity.
Readers are encouraged to align any financial activity with their own ethical, legal, and religious principles.
⚠️ DISCLAIMER
This material is strictly educational and informational.
It does not constitute financial advice, investment recommendations, or trading instructions.
The author does not provide personalized guidance.
Any decisions made based on this content are the sole responsibility of the individual.
関連の投稿
免責事項
この情報および投稿は、TradingViewが提供または推奨する金融、投資、トレード、その他のアドバイスや推奨を意図するものではなく、それらを構成するものでもありません。詳細は利用規約をご覧ください。
免責事項
この情報および投稿は、TradingViewが提供または推奨する金融、投資、トレード、その他のアドバイスや推奨を意図するものではなく、それらを構成するものでもありません。詳細は利用規約をご覧ください。