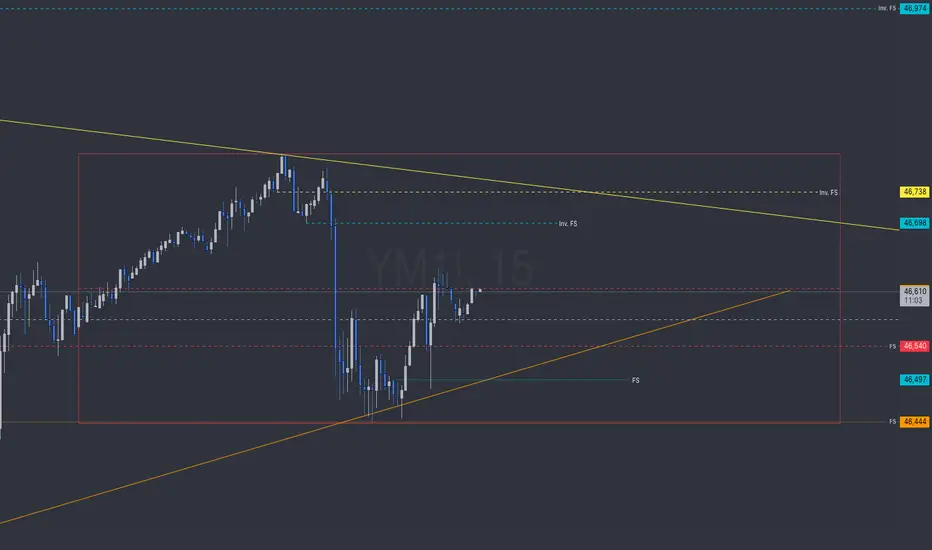
Levels are marked on the screen and color coded to the timeframe they were created on.
Weekly box is grey and shows the high, low and median range.
The red box is a daily high, low and median from yesterday.
Orange levels are 4hr timeframe
yellow is the hourly timeframe and blue is the 15min timeframe.
Weekly box is grey and shows the high, low and median range.
The red box is a daily high, low and median from yesterday.
Orange levels are 4hr timeframe
yellow is the hourly timeframe and blue is the 15min timeframe.
免責事項
これらの情報および投稿は、TradingViewが提供または保証する金融、投資、取引、またはその他の種類のアドバイスや推奨を意図したものではなく、またそのようなものでもありません。詳しくは利用規約をご覧ください。
免責事項
これらの情報および投稿は、TradingViewが提供または保証する金融、投資、取引、またはその他の種類のアドバイスや推奨を意図したものではなく、またそのようなものでもありません。詳しくは利用規約をご覧ください。