GOLD ROUTE MAP UPDATEHey Everyone,
We started the week with our Bearish target hit first at 2901, which gave multiple weighted level bounces of 30 pips plus. We were able to capitalise on these bounces, inline with our plans to buy dips.
We are now seeing price breakout of the 2901 Goldturn level and ema5 is about to lock. We will wait to confirm a lock for the continuation into the retracement level for further weighted level bounces. Failure to lock below 2901 will see a re-test back into the upper Goldturn.
We will see levels tested side by side until one of the weighted levels break and lock to confirm direction for the next range.
We will keep the above in mind when taking buys from dips. Our updated levels and weighted levels will allow us to track the movement down and then catch bounces up.
We will continue to buy dips using our support levels taking 30 to 40 pips. As stated before each of our level structures give 20 to 40 pip bounces, which is enough for a nice entry and exit. If you back test the levels we shared every week for the past 24 months, you can see how effectively they were used to trade with or against short/mid term swings and trends.
BULLISH TARGET
2922
EMA5 CROSS AND LOCK ABOVE 2922 WILL OPEN THE FOLLOWING BULLISH TARGET
2947
EMA5 CROSS AND LOCK ABOVE 2947 WILL OPEN THE FOLLOWING BULLISH TARGET
2968
BEARISH TARGETS
2901 - DONE
EMA5 CROSS AND LOCK BELOW 2901 WILL OPEN THE FOLLOWING RETRACEMENT RANGE
2878 - 2851
EMA5 CROSS AND LOCK BELOW 2851 WILL OPEN THE SWING RANGE
SWING RANGE
2820 - 2796
As always, we will keep you all updated with regular updates throughout the week and how we manage the active ideas and setups. Thank you all for your likes, comments and follows, we really appreciate it!
Mr Gold
GoldViewFX
Goldtradingstrategy

THE KOG REPORT THE KOG REPORT:
In last week’s KOG Report we said we would wait for the 2847-50 level to confirm support, and if it did the opportunity to long the market following KOG’s bias level targets would be available to traders. This worked well during the early part of the week as we managed to complete all targets by Tuesday! Once price confirmed encroaching the resistance we decided not to attempt the swing short, instead, trade the choppy range on the indicators which also worked well for traders.
Pre-NFP we released the KOG Report giving the idea to watch the support level 2910, if given the opportunity to long could be available into the higher levels on the boxes. Although we got the pinpoint long, the move did not complete after a 200pip+ capture, not a bad week at all, not only on Gold but all the other pairs we trade and analyse in Camelot hitting a phenomenal 32 Take profit levels.
Well done again to the community.
So, what can we expect in the week ahead?
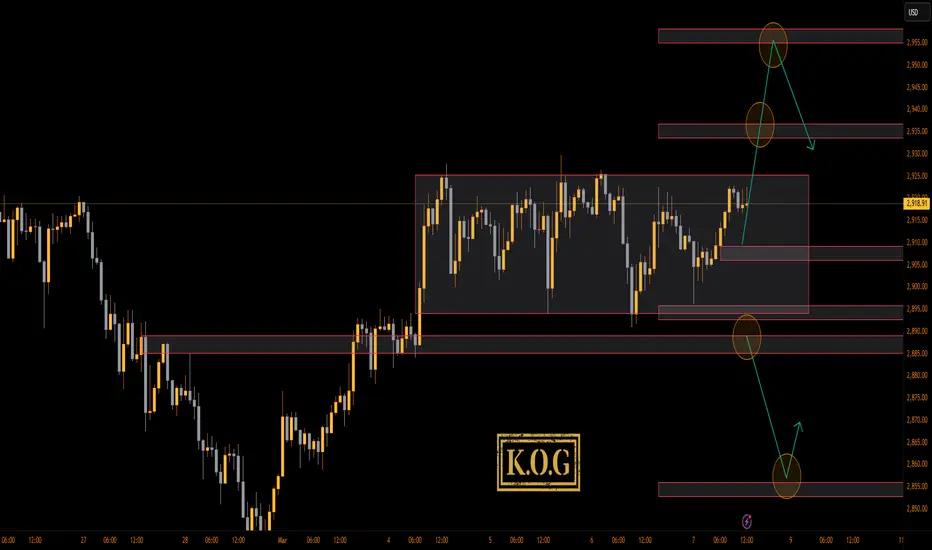
It’s a difficult one to decipher this week with the previous weeks range holding into the close on Friday. We have support below at the 2895 with extension into 2885 and resistance at 2930-35 with extension into the 2945 region. We also have the range high and low which you can see on the chart with a slight incline! For that reason, we would suggest best practice for market open is to wait, wait for price to break out of the range with the key levels here being 2920 which needs to break upside to start the move into the 2935 level and above that 2950-55 which is where we may get that potential swing short opportunity from. Please note, here we need to see a daily close above the 2935 region to continue the move upside, ideally, we want to see tap and bounces from these higher levels.
On the flip, if we see resistance at that 2920 level and get a close below our red box support level 2907-10, we can consider the level to level short trades downside targeting the 2885 and potentially below that 2970-75 for now.
As above we'll keep it simple for now, we can’t magic up an idea and hope for the best, when price accumulates like this, we have a fair idea of what it can do, but we need that set up to pull the trigger. Until that comes we can we'll just simply play the range.
You can see from past KOG Reports how extremely powerful the red boxes we share for free are, they almost play price to perfection. So, lets stick with them and let Excalibur lead the way for this week.
KOG’s Bias for the week:
Bullish above 2898 with targets above 2920, 2934 and above that 2945
Bearish on break of 2898 with targets below 2895, 2880, 2874 and below that 2868
RED BOXES:
Break above 2916 for 2920, 2925, 2929, 2933 and 2941 in extension of the move
Break below 2900 for 2885, 2876, 2870 and 2868 in extension of the move
Please do support us by hitting the like button, leaving a comment, and giving us a follow. We’ve been doing this for a long time now providing traders with in-depth free analysis on Gold, so your likes and comments are very much appreciated.
As always, trade safe.
KOG

GOLD TRADING POINT UPDATE >READ THE CHPATIAN Buddy'S dear friend 👋
SMC Trading Signals Update 🗾🗺️ Gold Traders SMC-Trading Point update you on New technical analysis setup for Gold 🪙 Gold Traders list time post signals Hit sucksfully My target point ) Now Gold making choch FVG level) FVG level 2897 + 2906 down 👇 👎 trend 📉 point below 👇 ⬇️ target point 2868- 2859 first. Hit sucksfully FVG level that take entry ☺️ 🥂 good luck 🤞
Key Resistance level 2897 + 2906
Key Support level 2868- 2859
Mr SMC Trading point
Pales support boost 🚀 analysis follow)

The golden counterattack is coming!As expected, gold rebounded with the support of 2880-2870 area, and has now rebounded to above 2893. Don't worry for now, gold still has room to rise. Don't be anxious for now, gold still has room to continue to rise. We insisted on buying gold on dips yesterday and have accumulated a lot of cheap chips. Now it seems to be a wise choice.
I clearly pointed out yesterday that the decline of gold this time is only to cooperate with the recent low of 2830 and successfully build a "W" double bottom structure. After confirming the support and building the "W" double bottom structure successfully, gold will continue to rise. Through the candle chart, we can clearly see that in the process of seeking support this time, gold just fell back to the 50% retracement level (50% retracement level from 2830 to 2930). At present, gold has confirmed the support and successfully built the "W" double bottom structure, which will support the rise of gold and provide good conditions for gold to break through the resistance near 2930 above, and even hope to try to hit the previous high near 2955.
Bros, I am glad that we are holding a lot of cheap chips now. These will be the chips that will bring us huge profits. Let us hold them together.Did you join me in taking the opportunity and going long gold?Trading means that everything has results and everything has feedback. I have been committed to market trading and trading strategy sharing, striving to improve the winning rate of trading and maximize profits. If you want to copy trading signals to make a profit, or master independent trading skills and thinking, you can follow the channel at the bottom of the article to copy trading strategies and signals

Gold is about to take off like a rocket, boldly go long gold!Bros, don't have any doubts about the rise of gold. Gold is just accumulating upward momentum during the shock process. Once the shock ends, gold will take off like a rocket.
In the short term, gold has tested the support of the 2900-2890 area many times and has never fallen below, confirming that the support in this area is effective. In addition, the candle chart forms multiple long lower shadows in the short period, indicating that the gold price refuses to fall, which will attract more off-market funds to buy gold. In this market, the longer the gold shock time, the higher the increase, so please relax and let us look forward to the gold rocket taking off! The first target in the short term is 2920. Once gold stands above 2920, gold is bound to reach 2930, and it is even expected to continue to rise to 2955
Trading means that everything has results and everything has feedback. I have been committed to market trading and trading strategy sharing, striving to improve the winning rate of trading and maximize profits. If you want to copy trading signals to make a profit, or master independent trading skills and thinking, you can follow the channel at the bottom of the article to copy trading strategies and signals

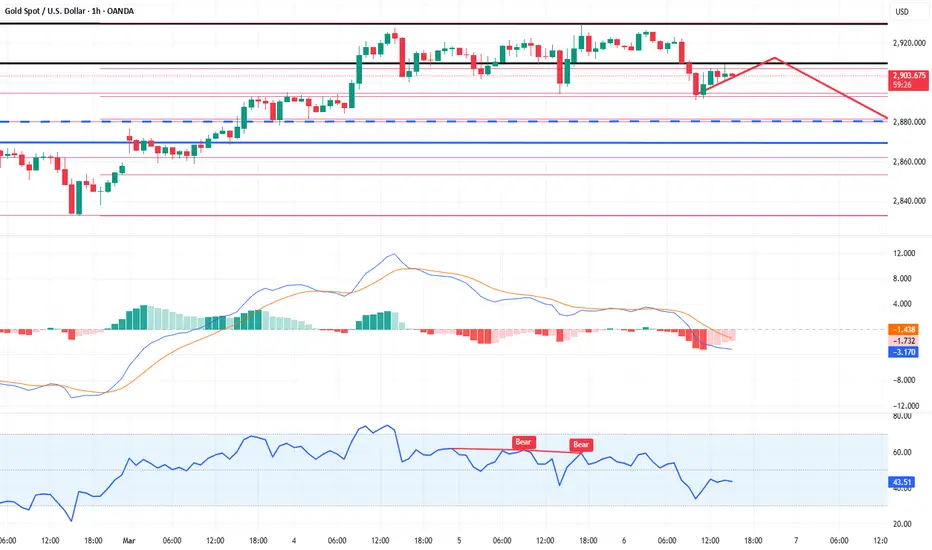
GOLD 1H CHART ROUTE MAP & TRADING PLAN FOR THE WEEKHey Everyone,
Please see our updated 1h chart levels and targets for the coming week.
We are seeing price play between two weighted levels with a gap above at 2922 and a gap below at 2901. We will need to see ema5 cross and lock on either weighted level to determine the next range.
We will see levels tested side by side until one of the weighted levels break and lock to confirm direction for the next range.
We will keep the above in mind when taking buys from dips. Our updated levels and weighted levels will allow us to track the movement down and then catch bounces up.
We will continue to buy dips using our support levels taking 30 to 40 pips. As stated before each of our level structures give 20 to 40 pip bounces, which is enough for a nice entry and exit. If you back test the levels we shared every week for the past 24 months, you can see how effectively they were used to trade with or against short/mid term swings and trends.
BULLISH TARGET
2922
EMA5 CROSS AND LOCK ABOVE 2922 WILL OPEN THE FOLLOWING BULLISH TARGET
2947
EMA5 CROSS AND LOCK ABOVE 2947 WILL OPEN THE FOLLOWING BULLISH TARGET
2968
BEARISH TARGETS
2901
EMA5 CROSS AND LOCK BELOW 2901 WILL OPEN THE FOLLOWING RETRACEMENT RANGE
2878 - 2851
EMA5 CROSS AND LOCK BELOW 2851 WILL OPEN THE SWING RANGE
SWING RANGE
2820 - 2796
As always, we will keep you all updated with regular updates throughout the week and how we manage the active ideas and setups. Thank you all for your likes, comments and follows, we really appreciate it!
Mr Gold
GoldViewFX

The gold long position is trapped, how to save yourself?Bros, gold suddenly continued to fall to the area around 2880. Are you afraid and scared about this?
I would like to ask if your long position is trapped? Brother, I can tell you loudly that I now hold a lot of long positions, and the average price is around 2893. Do you think I will worry about my long position? I am confident to tell you that I am not worried about my long position being trapped at all.
Although the continued decline of gold to around 2880 exceeded my expectations, gold is still in a long structure as a whole. The current decline of gold is only to cooperate with the recent low of 2832 to complete the construction of an effective "W" bottom structure, so I think gold will only fall back to the 2880-2870 zone at the lowest. So I think this is just the last decline of gold. Then gold will stop falling and rebound in the 2880-2870 zone, and is expected to hit 2930, or even around 2950.
Trading means that everything has results and everything has feedback. I have been committed to market trading and trading strategy sharing, striving to improve the winning rate of trading and maximize profits. If you want to copy trading signals to make a profit, or master independent trading skills and thinking, you can follow the channel at the bottom of the article to copy trading strategies and signals

Buy gold and wait for a breakoutBros, the recent rise and fall of gold has not continued, and the overall price is still fluctuating widely in the 2930-2895 area. After the fierce game between the long and short sides, there is not enough momentum to support the structural breakthrough of gold. However, according to the current structural trend, gold has repeatedly tested the area around 2920-2930 and has been effectively supported at 2890-2900. Overall, the probability of gold breaking upward is greater.
Then in short-term trading, we can temporarily go long on gold in the 2905-2985 area, and first see whether gold can stand above 2920. If gold stands above 2920 for a long time, then gold will definitely break through 2930 and still have the opportunity to test the previous high area near 2955.
Trading means that everything has results and everything has feedback. I have been committed to market trading and trading strategy sharing, striving to improve the winning rate of trading and maximize profits. If you want to copy trading signals to make a profit, or master independent trading skills and thinking, you can follow the channel at the bottom of the article to copy trading strategies and signals

GOLD WEEKLY CHART MID/LONG TERM ROUTE MAPHey Everyone,
Please see update on the weekly chart idea we have been tracking for over a month now and still playing out, as analysed.
Previously we stated that after completing 2856 target, we were left with body close above 2856 leaving a gap to 2976 but needed ema5 lock to further confirm this although we already took over 700 pips on the run, as its a big gap to chase in one go.
- We now have the ema5 lock to further confirm the long range gap above. If we see any rejections here due to volatility and news, then we would continue to look for the channel top for support for an ascending movement up, slowly over a longer term into our long range gap. Once again we prove the safest way to chase this Bull in this range is from dips.
This is the beauty of our channels, which we draw in our unique way, using averages rather than price. This enables us to identify fake-outs and breakouts clearly, as minimal noise in the way our channels are drawn.
Thank you all for your likes, comments and follows, we really appreciate it!
Mr Gold
GoldViewFX

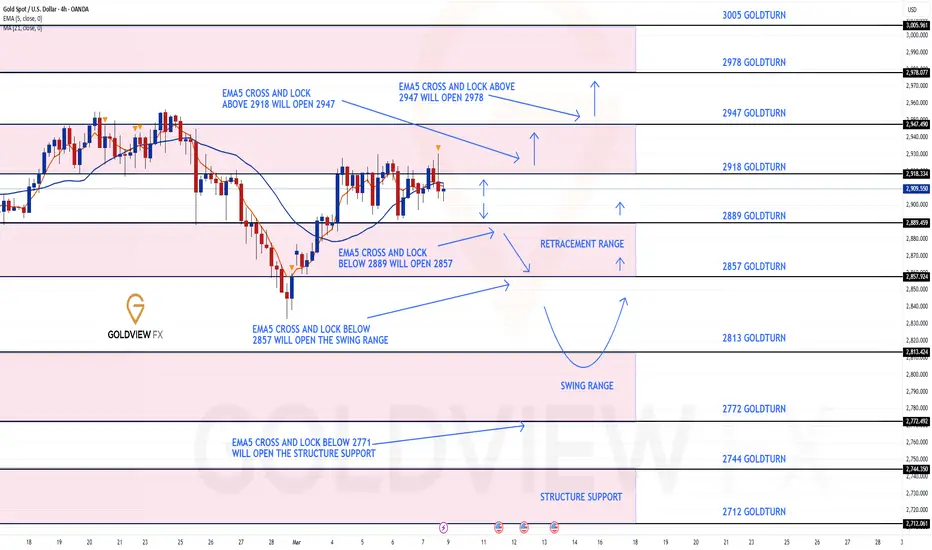
GOLD 4H CHART ROUTE MAP & TRADING PLAN FOR THE WEEKHey Everyone,
Please see our updated 4h chart levels and targets for the coming week.
We are seeing price play between two weighted levels with a gap above at 2918 and a gap below at 2889. We will need to see ema5 cross and lock on either weighted level to determine the next range.
We will see levels tested side by side until one of the weighted levels break and lock to confirm direction for the next range.
We will keep the above in mind when taking buys from dips. Our updated levels and weighted levels will allow us to track the movement down and then catch bounces up.
We will continue to buy dips using our support levels taking 30 to 40 pips. As stated before each of our level structures give 20 to 40 pip bounces, which is enough for a nice entry and exit. If you back test the levels we shared every week for the past 24 months, you can see how effectively they were used to trade with or against short/mid term swings and trends.
BULLISH TARGET
2918
EMA5 CROSS AND LOCK ABOVE 2918 WILL OPEN THE FOLLOWING BULLISH TARGET
2947
EMA5 CROSS AND LOCK ABOVE 2947 WILL OPEN THE FOLLOWING BULLISH TARGET
2978
BEARISH TARGETS
2889
EMA5 CROSS AND LOCK BELOW 2889 WILL OPEN THE FOLLOWING BEARISH TARGET
2857
EMA5 CROSS AND LOCK BELOW 2857 WILL OPEN THE SWING RANGE
SWING RANGE
2813 - 2772
As always, we will keep you all updated with regular updates throughout the week and how we manage the active ideas and setups. Thank you all for your likes, comments and follows, we really appreciate it!
Mr Gold
GoldViewFX
GOLD DAILY CHART MID/LONG TERM UPDATEHey Everyone,
This is an update on our daily chart idea that we are now tracking for a while now. If you have only started following us, please read the updates below from last week.
The half line of our unique channel gave the perfect bounce into the next axis target at 2904, inline with our plans to buy dips just like we stated. We now have a body close once again with ema5 cross and lock above 2904 leaving the range above open. We will continue to look for support at the ascending half-line of the channel, as we climb into the range.
This is the beauty of our Goldturn channels, which we draw in our unique way, using averages rather than price. This enables us to identify fake-outs and breakouts clearly, as minimal noise in the way our channels are drawn.
We will use our smaller timeframe analysis on the 1H and 4H chart to buy dips from the weighted Goldturns for 30 to 40 pips clean. Ranging markets are perfectly suited for this type of trading, instead of trying to hold longer positions and getting chopped up in the swings up and down in the range.
We will keep the above in mind when taking buys from dips. Our updated levels and weighted levels will allow us to track the movement down and then catch bounces up using our smaller timeframe ideas.
Our long term bias is Bullish and therefore we look forward to drops like this from rejections, which allows us to continue to use our smaller timeframes to buy dips using our levels and setups.
Buying dips allows us to safely manage any swings rather then chasing the bull from the top.
Thank you all for your likes, comments and follows, we really appreciate it!
Mr Gold
GoldViewFX
LAST WEEKS UPDATE
After completing our Bullish targets we stated that the channel top will act as resistance confirmed with ema5 rejection. A break of the channel top with ema5 would confirm a continuation and failure would confirm rejection. This allowed us to identify true breakouts against fake outs.
We also stated that we need to keep in mind the channel half line below to establish floor to provide support for the range, should we continue to track further up. A break below the half line will open the lower part of the channel to establish floor on the channel bottom. The safest way to track this movement is by buying dips.
- Once again this played out perfectly as we got the rejection on the channel top followed with the channel half line test, which gave the perfect bounce like we stated. We will now either look for a continuation from this bounce or a cross and lock below the half line for a break into the lower channel floor.

XAU/USD 11 March 2025 Intraday AnalysisH4 Analysis:
-> Swing: Bullish.
-> Internal: Bearish.
Analysis/Bias remains the same as analysis dated 07 March 2024.
Price has printed a bullish CHoCH according to analysis and bias dated 28 February 2025.
Price is currently trading within an established internal range.
Intraday Expectation:
Price is now trading in premium of 50% internal EQ where we could see a reaction at any point. Price could also target H4 supply zone before targeting weak internal low, priced at 2,832.720
Note:
With the Federal Reserve's dovish stance and persisting geopolitical uncertainties, heightened volatility in Gold is expected to continue. Traders should proceed with caution and adjust risk management strategies in this high-volatility environment.
Price could also be driven by President Trump's policies, geopolitical moves and economic decisions which are sparking uncertainty.
H4 Chart:
M15 Analysis:
-> Swing: Bullish.
-> Internal: Bearish.
Analysis and bias remains the same as analysis dated 03 March 2023.
As mentioned in my analysis dated 28 February 2025, whereby price printed a bullish CHoCH but stated I would continue to monitor price.
On this occasion I have marked the previous bullish CHoCH in red as price did not pull back deeply enough to warrant internal structure breaks, additionally, there was minimal time spent .
Price has printed a further bullish CHoCH which is now confirmed. Price is not trading within an established internal range.
Intraday Expectation:
Price to continue bullish, react at either premium of internal 50% EQ, or M15 supply zone before targeting weak internal low priced at 2,832.720.
Note:
With the Federal Reserve maintaining a dovish stance and ongoing geopolitical tensions, volatility in Gold prices is expected to remain elevated. Traders should exercise caution, adjust risk management strategies, and stay prepared for potential price whipsaws in this high-volatility environment.
M15 Chart:

Gold is expected to hit 2930 again after gaining momentumBros, today gold continued to fall to around 2880, but I still insist on going long on gold. Don't give up on gold because of its band decline. I think this fall in gold may be the last opportunity for gold to fall before it rises, so I won't feel pessimistic because of this fall in gold.
Taking advantage of this decline opportunity, I have absorbed enough cheap chips. We can clearly see that although gold fell, it did not change its rising structure and did not break away from the rising trend; in addition, after gold rebounded from around 2832, there was not much room for correction, and this decline was obviously to cooperate with the low of 2832 to successfully build a "W" double bottom structure. This will form favorable conditions for breaking through the short-term resistance of 2930, and even lay the foundation for hitting the previous high near 2956.
This is why I still insist on going long on gold even when it is falling. If you are really scared by this decline, then I think you have missed the opportunity to go long on gold at a low point.
Bros, do you have the courage to go long on gold with me?Trading means that everything has results and everything has feedback. I have been committed to market trading and trading strategy sharing, striving to improve the winning rate of trading and maximize profits. If you want to copy trading signals to make a profit, or master independent trading skills and thinking, you can follow the channel at the bottom of the article to copy trading strategies and signals

Buy gold aggressively and grab bargains!Bros, I have just clearly pointed out in the last article that gold will continue to rise after repeatedly testing and confirming the support of the 2900-2890 zone. I expect gold to at least test the 2920-2930 area again, and once gold stands above 2920, it will inevitably break through 2930 and even hopefully reach the previous high of 2955 again.
So brothers, gold falling back to the 2900-2890 zone is a good time for us to pick up bargains. I have picked up a lot of bargains in this zone, have you picked them up?
Trading means that everything has results and everything has feedback. I have been committed to market trading and trading strategy sharing, striving to improve the winning rate of trading and maximize profits. If you want to copy trading signals to make a profit, or master independent trading skills and thinking, you can follow the channel at the bottom of the article to copy trading strategies and signals

Dangers of Giving Up Too Soon on a Trading Strategy GOLD, FOREX
There are hundreds of different strategies to trade. Some of them are losing ones, some provide modest results and some strategies are very profitable.
Novice traders often struggle to find the right strategy that suits their personality, financial goals and risk appetite. Unfortunately, they also tend to make some common mistakes that can undermine their performance and confidence.
❌ One of the biggest mistakes that they make in their search is that they give a strategy a very short trial period. It simply means that they are trying to assess the validity of the strategy, trading that for a very short time span (usually a day to a week).
Please, realize the fact that the performance of the strategy can be measured only with extended backtesting - meaning that the strategy should be tested on multiple financial instruments and for a long period of time and applying multiple evaluation metrics.
Moreover, if the strategy proves its efficiency on backtesting, it should be traded on a demo account at least 2 months before the valid performance can be calculated.
❌ Another common mistake is that many traders drop the strategy once it starts losing. And by losing, I mean just 2–3 trades in a row.
Newbies are searching for the approach that never loses.
They may even abandon a trading strategy once they catch JUST ONE bad trade.
✅ In contrast, a smart trader realizes that one bad trade does not define the performance of the strategy. Moreover, such a trader calmly faces the losing streaks and sticks to the strategy.
Take a look at that picture.
On the top, we have the traits of a newbie trader and his equity curve.
He abandons the strategy after he faces the loss, not giving the strategy a chance to recover.
When he changes the strategy, he starts recovering a little bit and a losing period follows.
He drops a strategy again, and he keeps following this vicious cycle till his entire account is blown.
On the bottom of the picture, we see the equity curve of a smart trader.
Even though he faces losses occasionally, his strategy always gives him a chance to recover and with time his trading account steadily grows.
Please, realize the fact that a perfect strategy does not exist. You will lose the money occasionally anyway. What distinguishes a smart trader from a dumb one is his discipline and trust to his trading system and willingness to face losses.
❤️Please, support my work with like, thank you!❤️
I am part of Trade Nation's Influencer program and receive a monthly fee for using their TradingView charts in my analysis.

GOLD ROUTE MAP UPDATEHey Everyone,
PIPTASTIC finish to the week!!!!
After updating our 1H chart all week with perfect weighted level bounces, clearing our Bullish targets from every dip, we now finish up with our 4H chart update.
We got our 2889 target start of the week, followed with EMA5 cross and lock opening 2914, which was also hit perfectly. We then got our ema5 lock above 2914, opening the range above. We were able to ride this all the way into 2930 with more room left for the full gap. However, end of week now, so we will update our charts for Sunday for the week ahead.
BULLISH TARGET
2889 - DONE
EMA5 CROSS AND LOCK ABOVE 2889 WILL OPEN THE FOLLOWING BULLISH TARGET
2914 - DONE
We will now come back Sunday with our updated Multi time-frame analysis, Gold route map and trading plans for the week ahead and also a new Daily chart long term chart idea, now that this one is complete.
Have a smashing weekend!! And once again, thank you all for your likes, comments and follows, we really appreciate it!
Mr Gold
GoldViewFX

THE KOG REPORT - NFPTHE KOG REPORT – NFP
This is our view for NFP, please do your own research and analysis to make an informed decision on the markets. It is not recommended you try to trade the event if you have less than 6 months trading experience and have a trusted risk strategy in place. The markets are extremely volatile, and these events can cause aggressive swings in price.
Firstly, we would suggest traders stay away from this NFP altogether, the markets are very delicate and moving to extreme levels not only on Gold but most forex pairs. For that reason we’ll keep it simple and look at the key levels together with the structure formed.
We have the higher resistance level here which is the previous order region 2930-35 which looks to be a potential region price may want to attack if they want to continue this move upside, above that is the extension of the move around 2945-55. Price needs to stay below this level, If we can reject and not break above these levels, an opportunity to see the market correct may be available back down in attempt to break 2900 level.
On the flip, if they push price downside, we’ll wait, the range needs to be broken, price should want to retest the flip and then continue the move, that’s when we can start using the red boxes to target those lower levels and potentially look for the swing low from the circled hotspot.
As above, keep it simple, the trade comes after the event and most accounts are blown during these events due to traders using large lots on small accounts attempting to capture the volume driven candles. Unless you’re already in and protected, the swing in the opposite direction can cause huge problems to less experienced traders.
RED BOXES:
Break above 2930 for 2934, 2940, 2944 and 2955 in extension of the move
Break below 2910 for 2903, 2895, 2890 and 2879 in extension of the move
Please do support us by hitting the like button, leaving a comment, and giving us a follow. We’ve been doing this for a long time now providing traders with in-depth free analysis on Gold, so your likes and comments are very much appreciated.
As always, trade safe.
KOG
Unswervingly short goldRecently, gold was rejected at 2930, then rejected near 2925, and today gold was rejected again near 2920. From this point of view, the resistance area of gold moves down, and the high point drops accordingly. If gold is repeatedly rejected near 2915 next, then gold will have more room to fall.
This is also the reason why I advocate shorting gold recently. At present, I still hold a short position in gold and look forward to the performance of gold and its fall back to the 2880-2870 area, or even 2860.
Bros, only by following the right people can you execute the right transactions and master the skills to make money. If you want to master independent trading skills and thinking while copying trading signals and making stable profits, you can join the channel at the bottom of this article to liberate your trading talent!

Short gold! Target to earn 400 pips!!!Bros, gold has failed to effectively break through the 2920 area after many attempts during the rebound, and has consumed too much bull momentum near the resistance area. The shorts will become relatively stronger; gold has just fallen below 2900 strongly during the decline, further indicating that gold will choose a downward direction, and the current gold rebound is more likely to reserve room for a decline in the NFP market tomorrow.
So in terms of short-term trading, I still insist on shorting gold. At the latest on Friday in the US market, I expect gold to usher in a wave of big declines, at least retreating to the 2880-2870 area again, or even near the 2860 area. Brothers, are you optimistic about the big decline in gold?
Bros, only by following the right people can you execute the right transactions and master the skills to make money. If you want to master independent trading skills and thinking while copying trading signals and making stable profits, you can join the channel at the bottom of this article to liberate your trading talent!

GOLD ROUTE MAP UPDATEHey Everyone,
We sound like a broken record but once again a great day on the markets with our chart idea playing out, as analysed.
We had a repeat of yesterday with no lock above 2921 once again, which followed with the rejection into the lower Goldturn for the support test and bounce back into 2921, perfectly inline with our plans to buy dips. We are safely buying dips in this range, while price is bouncing between both the weighted Goldlturns. Once again we will now wait for ema5 to lock for a continuation or a rejection back into lower Goldturns.
We will keep the above in mind when taking buys from dips. Our updated levels and weighted levels will allow us to track the movement down and then catch bounces up.
We will continue to buy dips using our support levels taking 30 to 40 pips. As stated before each of our level structures give 20 to 40 pip bounces, which is enough for a nice entry and exit. If you back test the levels we shared every week for the past 24 months, you can see how effectively they were used to trade with or against short/mid term swings and trends.
BULLISH TARGET
2872 - DONE
EMA5 CROSS AND LOCK ABOVE 2872 WILL OPEN THE FOLLOWING BULLISH TARGET
2901 - DONE
EMA5 CROSS AND LOCK ABOVE 2901 WILL OPEN THE FOLLOWING BULLISH TARGET
2921 - DONE
EMA5 CROSS AND LOCK ABOVE 2921 WILL OPEN THE FOLLOWING BULLISH TARGET
2950
BEARISH TARGETS
2846
EMA5 CROSS AND LOCK BELOW 2846 WILL OPEN THE FOLLOWING BEARISH TARGET
2820
EMA5 CROSS AND LOCK BELOW 2820 WILL OPEN THE FOLLOWING BEARISH TARGET
2796
EMA5 CROSS AND LOCK BELOW 2796 WILL OPEN THE SWING RANGE
SWING RANGE
2778 - 2753
As always, we will keep you all updated with regular updates throughout the week and how we manage the active ideas and setups. Thank you all for your likes, comments and follows, we really appreciate it!
Mr Gold
GoldViewFX

Gold is about to plummet! Short gold!!!Bros, gold is about to fall sharply. I have shorted gold again. Are you ready? If you don't short gold now, you will completely lose the good opportunity to short gold.
At present, under the pressure of the triple top near 2930 in the technical form, gold has dropped and tested the 2900 mark again. It is only a matter of time before it completely breaks through. As the center of gravity of gold moves down, the upper short-term resistance moves down to the 2910-2920 zone. Under the pressure of the technical form and the fact that gold has just tentatively broken through the 2900 mark, gold still has more room to fall. It is expected that gold will at least retest the 2880-2870 zone in this round of decline, or even lower.
Bros, I have executed the short gold transaction, let us wait and see!Bros, are you optimistic that gold will continue to fall?Wise choices are far greater than hard work. Only by following the right people can we execute the right transactions and accumulate profits that change our lives and destiny. If you want to copy trading signals and make stable profits, or want to learn the correct trading logic and techniques in depth, you can consider joining the channel at the bottom of this article!
Continue to short gold after the reboundBros, overnight we shorted gold near 2923, and gold fell as expected and directly hit TP: 2908, and we took this opportunity to reap a lot of profits. Recently, I have been insisting on shorting gold, and have achieved 11 consecutive victories in shorting gold transactions. We have made a lot of money in short-term swing trading, and we will continue our trading journey and continue our glory.
At present, gold continues to fall and has rebounded slightly after hitting a low near 2891. Although the recent game between the long and short sides has been extremely fierce, to be honest, this wave of decline has directly fallen below the 2900 mark in the short term, and the strength of shorts is relatively strong; and gold has repeatedly hit 2930 failed, and a triple top structure was constructed at the short-term technical level. While it exerted absolute suppression on the gold price, it also strengthened and confirmed that 2956 is a stage high. Therefore, the short trend of gold may not be over, and gold will reverse again and continue to fall after rebounding.
Therefore, in short-term trading, I prefer to continue shorting gold after the rebound. As the center of gravity of gold moves downward, we can consider using the 2910-2920 zone as resistance and shorting gold in an appropriate amount. If gold touches this area and falls again, gold is expected to test the support of the 2880-2870 zone again.
Bros, are you optimistic that gold will continue to fall?Wise choices are far greater than hard work. Only by following the right people can we execute the right transactions and accumulate profits that change our lives and destiny. If you want to copy trading signals and make stable profits, or want to learn the correct trading logic and techniques in depth, you can consider joining the channel at the bottom of this article!

XAU/USD 06 March 2025 Intraday AnalysisH4 Analysis:
-> Swing: Bullish.
-> Internal: Bearish.
Price has printed a bullish CHoCH according to analysis and bias dated 28 February 2025.
Price is currently trading within an established internal range.
Intraday Expectation:
Price is now trading in premium of 50% internal EQ where we could see a reaction at any point. Price could also target H4 supply zone before targeting weak internal low, priced at 2,832.720
Note:
With the Federal Reserve's dovish stance and persisting geopolitical uncertainties, heightened volatility in Gold is expected to continue. Traders should proceed with caution and adjust risk management strategies in this high-volatility environment.
Price could also be driven by President Trump's policies, geopolitical moves and economic decisions which are sparking uncertainty.
H4 Chart:
M15 Analysis:
-> Swing: Bullish.
-> Internal: Bearish.
Analysis and bias remains the same as analysis dated 03 March 2023.
As mentioned in my analysis dated 28 February 2025, whereby price printed a bullish CHoCH but stated I would continue to monitor price.
On this occasion I have marked the previous bullish CHoCH in red as price did not pull back deeply enough to warrant internal structure breaks, additionally, there was minimal time spent .
Price has printed a further bullish CHoCH which is now confirmed. Price is not trading within an established internal range.
Intraday Expectation:
Price to continue bullish, react at either premium of internal 50% EQ, or M15 supply zone before targeting weak internal low priced at 2,832.720.
Note:
With the Federal Reserve maintaining a dovish stance and ongoing geopolitical tensions, volatility in Gold prices is expected to remain elevated. Traders should exercise caution, adjust risk management strategies, and stay prepared for potential price whipsaws in this high-volatility environment.
M15 Chart:
