OPEN-SOURCE SCRIPT
Cybernetic Sine Wave
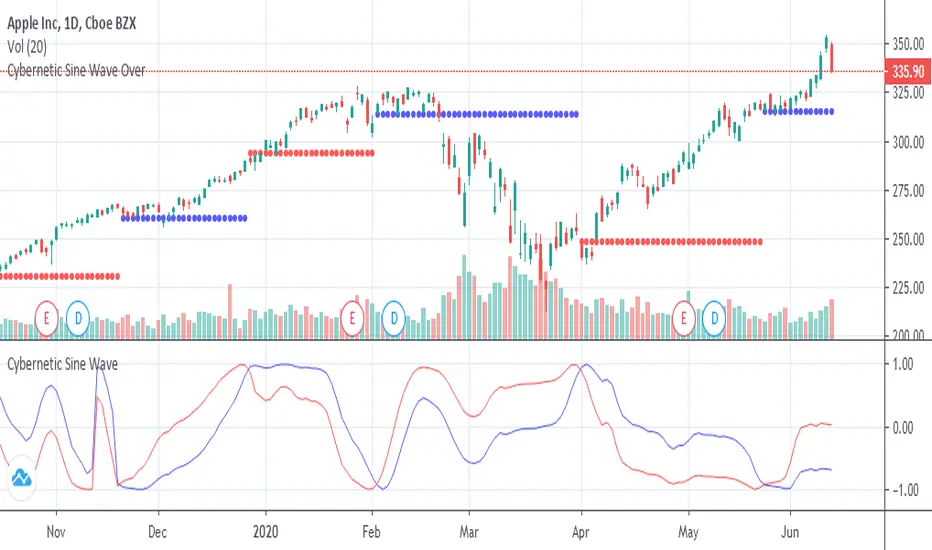
This is John F. Ehlers "Sine Wave Indicator" on the book "Cybernetic Analysis for Stocks and Futures".
When red crosses under blue there is a resistance and the price should fall and when red crosses over blue there is a support and the price should rise, but, the market is always right,
if instead of turning down on the resistance it surpasses it there is a trend up, if instead of turning up on the the support it falls through it there is a trend down.
オープンソーススクリプト
TradingViewの精神に則り、このスクリプトの作者はコードをオープンソースとして公開してくれました。トレーダーが内容を確認・検証できるようにという配慮です。作者に拍手を送りましょう!無料で利用できますが、コードの再公開はハウスルールに従う必要があります。
免責事項
この情報および投稿は、TradingViewが提供または推奨する金融、投資、トレード、その他のアドバイスや推奨を意図するものではなく、それらを構成するものでもありません。詳細は利用規約をご覧ください。
オープンソーススクリプト
TradingViewの精神に則り、このスクリプトの作者はコードをオープンソースとして公開してくれました。トレーダーが内容を確認・検証できるようにという配慮です。作者に拍手を送りましょう!無料で利用できますが、コードの再公開はハウスルールに従う必要があります。
免責事項
この情報および投稿は、TradingViewが提供または推奨する金融、投資、トレード、その他のアドバイスや推奨を意図するものではなく、それらを構成するものでもありません。詳細は利用規約をご覧ください。