OPEN-SOURCE SCRIPT
Highs/Lows difference [OrganicPunch]
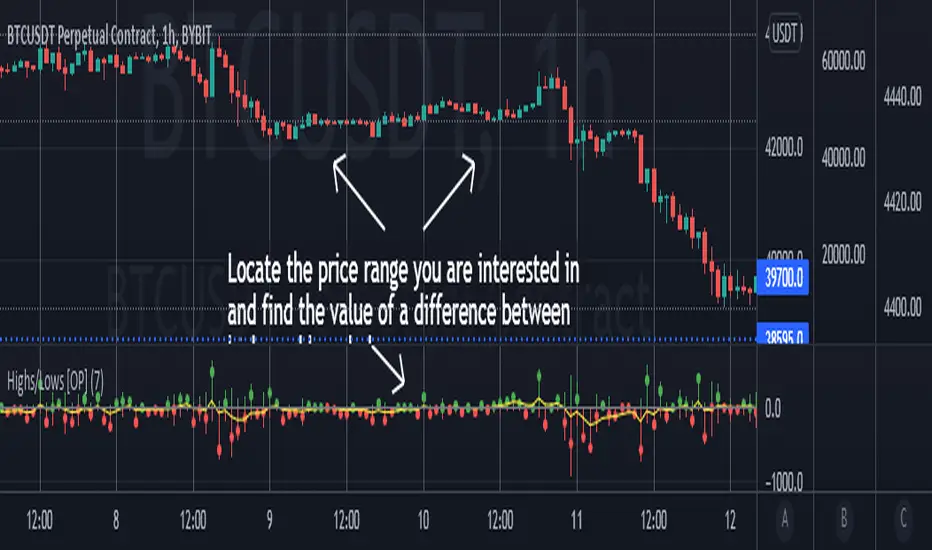
Highs/Lows difference indicator
To visually evaluate the difference between highs and lows of a price range.
This handsome indicator shows:
To read the numerical value, point at the circle of the relevant bar you are interested in, and see the scale.
Indicator is useful in creating strategies where you want to filter out consolidations/ranges (or to locate them), e.g. "Open trade when H/L difference is larger than 200", or "Look for candles with H/L difference lesser than 50".
The exact value of needed H/L difference can be found using this indicator.
To visually evaluate the difference between highs and lows of a price range.
This handsome indicator shows:
- difference between highs of 2 candles by displaying it in green histogram
- difference between lows of 2 candles by displaying it in red histogram
- difference between both highs and lows by displaying a circle at the level of the difference
To read the numerical value, point at the circle of the relevant bar you are interested in, and see the scale.
Indicator is useful in creating strategies where you want to filter out consolidations/ranges (or to locate them), e.g. "Open trade when H/L difference is larger than 200", or "Look for candles with H/L difference lesser than 50".
The exact value of needed H/L difference can be found using this indicator.
オープンソーススクリプト
TradingViewの精神に則り、このスクリプトの作者はコードをオープンソースとして公開してくれました。トレーダーが内容を確認・検証できるようにという配慮です。作者に拍手を送りましょう!無料で利用できますが、コードの再公開はハウスルールに従う必要があります。
免責事項
この情報および投稿は、TradingViewが提供または推奨する金融、投資、トレード、その他のアドバイスや推奨を意図するものではなく、それらを構成するものでもありません。詳細は利用規約をご覧ください。
オープンソーススクリプト
TradingViewの精神に則り、このスクリプトの作者はコードをオープンソースとして公開してくれました。トレーダーが内容を確認・検証できるようにという配慮です。作者に拍手を送りましょう!無料で利用できますが、コードの再公開はハウスルールに従う必要があります。
免責事項
この情報および投稿は、TradingViewが提供または推奨する金融、投資、トレード、その他のアドバイスや推奨を意図するものではなく、それらを構成するものでもありません。詳細は利用規約をご覧ください。