PINE LIBRARY
更新済 DrawIndicatorOnTheChart

Library "DrawIndicatorOnTheChart"
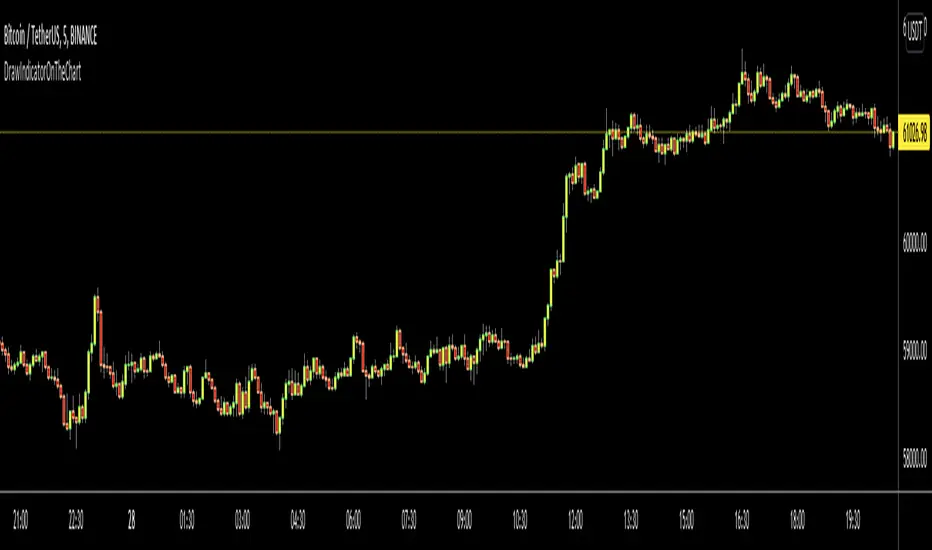
this library is used to show an indicator (such RSI, CCI, MOM etc) on the main chart with indicator's horizontal lines in a window. Location of the window is calculated dynamically by last price movemements
drawIndicator(indicatorName, indicator, indicatorcolor, period, indimax_, indimin_, levels, precision, xlocation) draws the related indicator on the chart
Parameters:
indicatorName: is the indicator name as string such "RSI", "CCI" etc
indicator: is the indicator you want to show, such rsi(close, 14), mom(close, 10) etc
indicatorcolor: is the color of indicator line
period: is the length of the window to show
indimax_: is the maximum value of the indicator, for example for RSI it's 100.0, if the indicator (such CCI, MOM etc) doesn't have maximum value then use "na"
indimin_: is the minimum value of the indicator, for example for RSI it's 0.0, if the indicator (such CCI, MOM etc)doesn't have maximum value then use "na"
levels: is the levels of the array for the horizontal lines. for example if you want horizontal lines at 30.0, and 70.0 then use array.from(30.0, 70.0). if no horizontal lines then use array.from(na)
precision: is the precision/number of decimals that is used to show indicator values, for example for RSI set it 2
xlocation: is end location of the indicator window, for example if xlocation = 0 window is created on the index of the last bar/candle
Returns: none
リリースノート
v2background color of the window changed as black
リリースノート
v3リリースノート
v4リリースノート
v5: - updated to show multiple indicator lines for the indicators such DMI
- so indicator parameter changed to indicator1, indicator2, indicator3 (if indicator2 or indicator3 doesn't exist then send na value)
- added line width parameter
- color parameter changed to the array
Updated:
drawIndicator(enabled, indicatorName, indicator1, indicator2, indicator3, indicatorcolor, period, indimax_, indimin_, levels, precision, xlocation, lnwidth) draws the related indicator on the chart
Parameters:
enabled: if it's enabled to show
indicatorName: is the indicator name as string such "RSI", "CCI" etc
indicator1: is first indicator you want to show, such rsi(close, 14), mom(close, 10) etc
indicator2: is second indicator you want to show, such -DI of DMI
indicator3: is third indicator you want to show, such ADX of DMI
indicatorcolor: is the color of indicator line
period: is the length of the window to show
indimax_: is the maximum value of the indicator, for example for RSI it's 100.0, if the indicator (such CCI, MOM etc) doesn't have maximum value then use "na"
indimin_: is the minimum value of the indicator, for example for RSI it's 0.0, if the indicator (such CCI, MOM etc)doesn't have maximum value then use "na"
levels: is the levels of the array for the horizontal lines. for example if you want horizontal lines at 30.0, and 70.0 then use array.from(30.0, 70.0). if no horizontal lines then use array.from(na)
precision: is the precision/nuber of decimals that is used to show indicator values, for example for RSI set it 2
xlocation: is end location of the indicator window, for example if xlocation = 0 window is created on the index of the last bar/candle
lnwidth: is the line width of the indicator lines
Returns: none
リリースノート
v6Somehow indicator doesn't show the lines. fixed. Thank to TanHef for the solution
Pineライブラリ
TradingViewの精神に則り、作者はこのPineコードをオープンソースライブラリとして公開してくれました。コミュニティの他のPineプログラマーが再利用できるようにという配慮です。作者に拍手を!このライブラリは個人利用や他のオープンソースの公開コンテンツで使用できますが、公開物でのコードの再利用はハウスルールに準じる必要があります。
🤝 LonesomeTheBlue community
t.me/LonesomeTheBlue_Official
🎦 YouTube Channel
Youtube.com/@lonesometheblue/videos
💰 Subscription to Pro indicators
Tradingview.com/spaces/LonesomeTheBlue/
t.me/LonesomeTheBlue_Official
🎦 YouTube Channel
Youtube.com/@lonesometheblue/videos
💰 Subscription to Pro indicators
Tradingview.com/spaces/LonesomeTheBlue/
免責事項
この情報および投稿は、TradingViewが提供または推奨する金融、投資、トレード、その他のアドバイスや推奨を意図するものではなく、それらを構成するものでもありません。詳細は利用規約をご覧ください。