OPEN-SOURCE SCRIPT
更新済 William %R MTF [DM]
Greeting Colleagues
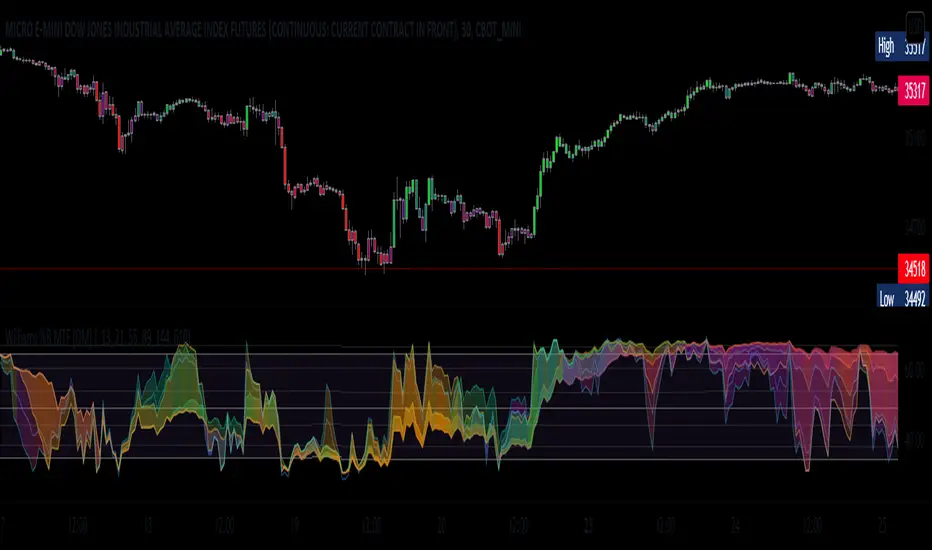
Today I share The Wlliams %R
Extras=
- 5 diferent length
- 1 extra signal with the technique used in the ultimate oscillator
- Fibo Leves based on ob os leves "width it's automatic"
- Colored bars bassed en average strength
- The indicator that is modified now has the same range as the ultimate oscillator.
Enjoy [;-)
//The Williams %R (%R) indicator was created by famed commodities trader and author Larry Williams.
//
//Calculation
//%R = (CurrentClose - Highest High) / (Highest High - Lowest Low) x -100
//
//Highest High = Highest High for the user defined look-back period.
//Lowest Low = Lowest Low for the user defined look-back period.
//
//The basics
//As previously mentioned, the %R is used to measure momentum. %R oscillates
//within a fixed range between the values of 0 and -100. Williams himself set the
//parameters of overbought as any reading between 0 and -20. His oversold
//parameters were readings between -80 and -100. It is important to note that these
//values are traditional examples. It may be beneficial for the technical analyst
//to set different parameters based on the specific instrument being analyzed. Wider
//or narrower overbought and oversold levels may be appropriate based on historical analysis.
//
//What to look for
//There are two major conditions identified by using the %R indicator.
//The first is standard overbought and oversold conditions. The second is momentum
//changes characterized by momentum failures.
//
//Overbought/Oversold
//Overbought and Oversold conditions are a very common signal generated by momentum oscillators.
//The %R indicator is no different.
リリースノート
Minor changesリリースノート
Added butterfly color rules to plotsAdded switch to hide parcels
リリースノート
Minor changesリリースノート
Added black background for use in the white chartsオープンソーススクリプト
TradingViewの精神に則り、このスクリプトの作者はコードをオープンソースとして公開してくれました。トレーダーが内容を確認・検証できるようにという配慮です。作者に拍手を送りましょう!無料で利用できますが、コードの再公開はハウスルールに従う必要があります。
免責事項
この情報および投稿は、TradingViewが提供または推奨する金融、投資、トレード、その他のアドバイスや推奨を意図するものではなく、それらを構成するものでもありません。詳細は利用規約をご覧ください。
オープンソーススクリプト
TradingViewの精神に則り、このスクリプトの作者はコードをオープンソースとして公開してくれました。トレーダーが内容を確認・検証できるようにという配慮です。作者に拍手を送りましょう!無料で利用できますが、コードの再公開はハウスルールに従う必要があります。
免責事項
この情報および投稿は、TradingViewが提供または推奨する金融、投資、トレード、その他のアドバイスや推奨を意図するものではなく、それらを構成するものでもありません。詳細は利用規約をご覧ください。