INVITE-ONLY SCRIPT
LIZ TIME DIMENSION (SMA)
アップデート済
Each hourly foot can display the moving average line for the same period of time in the same color.
The average moving line that you want to see is displayed by time leg, as well as the long-term Bollinger band that should be noticed by the time leg.
1. You can get a lot of useful information at a glance by displaying the moving average line of the long-term and period setting that many traders are aware of.
○ The period setting of the moving average line displayed in each time and foot is not fixed as usual, but changed the period by time and foot, and the moving average line of the same color
is the same.
It is a moving average line of time (for example, an hourly average line and a four-hour average line).Therefore, the market price is always the same even if the time to see changes
You can see it on a scale.It doesn't happen when you look at it in five minutes, but when you look at it in four hours, it looks like a downward trend.
○ The sensitivity of the rate to the moving average line displayed is very high.
You can see how rate moves, such as trends, are determined, and you can see reality in abstract chart moves
I can feel it.Purple 24 hours (one day) moving average line with 1 minute to 4 hours of foot, Green 1 week moving average line with 5 minute to day.
The sensitivity to the Blue Monthly Movement Average Line, which is displayed from 5 mins to 5 weeks, and Red One Year Movement Average Line, which is displayed from 1 hour to 5 weeks,
is very high.
Just look at whether the rates are moving up or down the moving average line and you'll be able to decide what to look for.
○ What is the positional relation between the moving average line of seven (eight in addition to the weekly moving average line) in the short, short, medium, medium, long, and long periods?
To make the direction and intensity of the trend easier to recognize, it is colored between moving averages to be visible as short- and medium-term clouds.
The three clouds changed color to warm rising clouds and cold falling clouds, depending on the relation of the moving averages.
·Strong upward trend rates when all clouds are unified in either upward or downward direction and are arranged in the order of short-term, medium-term or long-term clouds
·The thickness of the clouds is strong, and when the thickness is increased, the trend rate is strong.
·Trendless market when clouds overlap or the colors of the clouds are mixed
• Range price when rates are moving back and forth between clouds
You can visually and intuitively understand the market conditions, such as .
○ Short-term, short-term, medium- and short-term positional relationships will indicate the timing of the entry payment and the direction of the long-short.It's also written.
In conjunction with this, the duration for which the background color should be long changes to light warm color and warm color, and the duration for short changes to light cold and cold
color.
2. The long-term Bollinger band is displayed so that you can trade with the higher time base than the time base you see.
○ You can ride on a long-term trend by detecting and entering the trend occurrence of long-term feet with short-term feet.
Buy high prices, sell low prices, relax your trend-follow-style tears, and enable stress-free entries.
○ A light, transparent gray filter is displayed between the long-term foot Bollinger band ±1σ which sets the period suitable for the time and foot.
I understand that while the rate is moving in this zone (called gray zone), it is difficult to trend and the price range is small, so it should not be taken care of.
Yes, you can use this filter to prevent deception when the volatility is not present, and if you are out of the filter, you can use the above sign.
By trading in accordance, you can invest in trend-follow tiles while avoiding losses in range markets.
○ Bollinger bands generally display six of ±1σ, ±2σ and ±3σ, but in this indicator, two are inside ±1σ and two are outside ±3σ.
We have added a total of four bands.The former sets up early entries and the latter sets up new reverse positions, expecting a market shift from overheating.
for tips on how to
○ Expansion period (expansion period) due to characteristics of the Bollinger band is a period when volatility is big for trade, and a squeeze period
(Shrinking period) I understand that the volatility is small and it is not suitable for trade.Also, it's a squeeze period, but it's not
You can seize investment opportunities by making you expect the timing to move from contraction to expansion and by watching.
※Valid time difference by series
1 minute, 5 minutes, 15 minutes, 30 minutes 1 Hour, 4 Hour, Daily, Week (Total 8 Hours)
。This is the top version of the Makenai Chart indicator.
。Bolinger band ±3σ with 200 SMA and 200 SMA as the center band is now displayed in common on each hour leg.
。Changing the setting of the foot short-term moving average line for 5 minutes 15 minutes 30 minutes 1 hour to make the short-term cloud easily twisted and to speed up the trading timing.
。Adding ultra short term and short term clouds, which are much shorter than short term clouds, we responded to the requests of traders who want to deal with the roller coaster market and
cut the profit quickly.
(Select short-term clouds, short-term clouds, and ultra-short-term clouds to be used for entry and settlement according to the trade style and the 'dissociation between price and moving average'
which varies depending on the brand, time, and market value.)
。According to the calculation of another indicator (LIZ ADX+DMI), the background has become gray synchronously for a period of inactivity and non-trading.
(In such a period, it is often difficult to follow the trend because the market price is difficult even for lower-level ones, and often it is difficult to follow the trend.)
·Many indicators are counted in one, so you can also view the free version of your account, which has three indicators to display.
The moving avarage lines are SMA. ( I have another version which has EMA lines.)
If you are interested in the invitation-only indicator, please contact us on private chat.
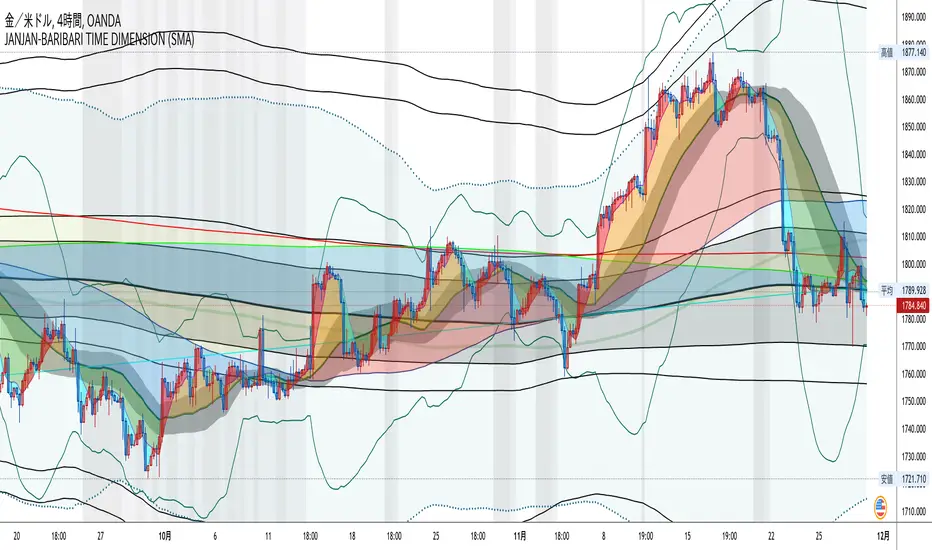
各時間足で同じ期間の移動平均線が同じ色で表示できます。
時間足によって見たい複数の移動平均線が表示される他、その時間足で意識すべき期間設定された長期ボリンジャーバンドも表示されます。
1.長期間でかつ多くのトレーダーが意識する期間設定の移動平均線が表示される事で
以下の有益な情報を一目で得る事ができます。
○各時間足に表示される移動平均線の期間設定は、通常のように期間を一定にするの ではなく、期間を時間足毎に変え同色の移動平均線は同じ時間の移動平均線
(例えば1時間平均線、4時間平均線というように。)としてあります。
このため、見る時間足が変わっても、相場を常に同じ尺度で眺める事ができます。
「5分足では上昇トレンドに、4時間足では下落トレンドに見える。」
という事が起こりません。
○表示される移動平均線に対するレートの感応度は非常に高く、移動平均線にレ-ト
が差し掛かると抵抗を受け反発したり移動平均線を抜けると、勢いよくトレンドが
発生するなど、レートの動きがどのようにして決まっているかを実感でき、抽象的
だったチャートの動きにリアリティーを感じる事ができます。
特に1分足から4時間足まで表示される紫24時間(1日)移動平均線、5分足から
日足まで表示される緑1週間移動平均線、5分足から週足まで表示される青1ヶ月
移動平均線、1時間足から週足まで表示される赤1年移動平均線に対する感応度は
非常に高く、それぞれの移動平均線の上下どちらでレートが推移しているかを見る
だけで、買い目線売り目線の決定ができます。
○短々期、短期、中短期、中期、中長期、長期、長々期の7本
(週足だけはそれに加え最長期の8本)の移動平均線がどのような位置関係にあるか
によってトレンドの方向と強さが認識しやすいよう移動平均線間に着色し短期雲、
中期雲として意識できるようになっています。
3つの雲は移動平均線の関係によりそれぞれ暖色の上昇雲、寒色の下落雲に色が変わり、
・全ての雲が上昇下落どちらかに統一されで短期雲、中期雲、長期雲という順に並
んでいる時は強い上昇トレンド相場
・雲の傾きがきつく厚みがしっかりしている、厚みが増している時は強いトレンド相場
・雲が重なったり、各雲の色がまちまちの時はトレンドレス相場
・雲と雲の間をレートが行ったり来たりしている時はレンジ相場
など、視覚的直感的に相場の状況が理解できます。
表示が可能な時間足は1分、5分、15分 30分、60分、4時間、1日、1週間(合計8つ)です。
※Makenai Chart Indicator の上位版です。
・200SMA,200SMAを中心バンドとするボリンジャーバンド±3σが各時間足に共通で表示されるようになりました。
・5分15分30分1時間足短期移動平均線の設定を変更し、短期雲がねじれやすくし、決済タイミングを早めました。
・短期雲よりさらに短い、超短期雲・短々期雲を追加し、ジェットコースター相場への対応、早めに利確・損切りしたいトレーダーの要望に対応しました。
(トレードスタイルに応じ、また銘柄・時間足・相場つきによって変わる『価格と移動平均線との解離』に応じ、エントリー・決済に使う短期雲・短々期雲・超短期雲を選択します。)
・別のインジケーター(LIZ ADX+DMI)の計算による、ボラティティーがなくトレードに向かない期間は、同期して背景がグレーになるようになりました。
(LIZ ADX+DMIの詳細はこちらのリンクからご覧になれます。 )
(そのような期間は下位足でも難しい相場つき、レンジやランダム相場になっている事が多いため、トレンドフォローが難しい可能性が高いです。)
・たくさんのインジケーターが1つにカウントされるため、表示できるインジケーター3つの制限がある、無料版のアカウントをお使いの方も表示できます
移動平均線はSMAです。(EMA線がある別のバージョンがあります)
招待専用インジに興味ある方はプライベートチャットに連絡をください。
The average moving line that you want to see is displayed by time leg, as well as the long-term Bollinger band that should be noticed by the time leg.
1. You can get a lot of useful information at a glance by displaying the moving average line of the long-term and period setting that many traders are aware of.
○ The period setting of the moving average line displayed in each time and foot is not fixed as usual, but changed the period by time and foot, and the moving average line of the same color
is the same.
It is a moving average line of time (for example, an hourly average line and a four-hour average line).Therefore, the market price is always the same even if the time to see changes
You can see it on a scale.It doesn't happen when you look at it in five minutes, but when you look at it in four hours, it looks like a downward trend.
○ The sensitivity of the rate to the moving average line displayed is very high.
You can see how rate moves, such as trends, are determined, and you can see reality in abstract chart moves
I can feel it.Purple 24 hours (one day) moving average line with 1 minute to 4 hours of foot, Green 1 week moving average line with 5 minute to day.
The sensitivity to the Blue Monthly Movement Average Line, which is displayed from 5 mins to 5 weeks, and Red One Year Movement Average Line, which is displayed from 1 hour to 5 weeks,
is very high.
Just look at whether the rates are moving up or down the moving average line and you'll be able to decide what to look for.
○ What is the positional relation between the moving average line of seven (eight in addition to the weekly moving average line) in the short, short, medium, medium, long, and long periods?
To make the direction and intensity of the trend easier to recognize, it is colored between moving averages to be visible as short- and medium-term clouds.
The three clouds changed color to warm rising clouds and cold falling clouds, depending on the relation of the moving averages.
·Strong upward trend rates when all clouds are unified in either upward or downward direction and are arranged in the order of short-term, medium-term or long-term clouds
·The thickness of the clouds is strong, and when the thickness is increased, the trend rate is strong.
·Trendless market when clouds overlap or the colors of the clouds are mixed
• Range price when rates are moving back and forth between clouds
You can visually and intuitively understand the market conditions, such as .
○ Short-term, short-term, medium- and short-term positional relationships will indicate the timing of the entry payment and the direction of the long-short.It's also written.
In conjunction with this, the duration for which the background color should be long changes to light warm color and warm color, and the duration for short changes to light cold and cold
color.
2. The long-term Bollinger band is displayed so that you can trade with the higher time base than the time base you see.
○ You can ride on a long-term trend by detecting and entering the trend occurrence of long-term feet with short-term feet.
Buy high prices, sell low prices, relax your trend-follow-style tears, and enable stress-free entries.
○ A light, transparent gray filter is displayed between the long-term foot Bollinger band ±1σ which sets the period suitable for the time and foot.
I understand that while the rate is moving in this zone (called gray zone), it is difficult to trend and the price range is small, so it should not be taken care of.
Yes, you can use this filter to prevent deception when the volatility is not present, and if you are out of the filter, you can use the above sign.
By trading in accordance, you can invest in trend-follow tiles while avoiding losses in range markets.
○ Bollinger bands generally display six of ±1σ, ±2σ and ±3σ, but in this indicator, two are inside ±1σ and two are outside ±3σ.
We have added a total of four bands.The former sets up early entries and the latter sets up new reverse positions, expecting a market shift from overheating.
for tips on how to
○ Expansion period (expansion period) due to characteristics of the Bollinger band is a period when volatility is big for trade, and a squeeze period
(Shrinking period) I understand that the volatility is small and it is not suitable for trade.Also, it's a squeeze period, but it's not
You can seize investment opportunities by making you expect the timing to move from contraction to expansion and by watching.
※Valid time difference by series
1 minute, 5 minutes, 15 minutes, 30 minutes 1 Hour, 4 Hour, Daily, Week (Total 8 Hours)
。This is the top version of the Makenai Chart indicator.
。Bolinger band ±3σ with 200 SMA and 200 SMA as the center band is now displayed in common on each hour leg.
。Changing the setting of the foot short-term moving average line for 5 minutes 15 minutes 30 minutes 1 hour to make the short-term cloud easily twisted and to speed up the trading timing.
。Adding ultra short term and short term clouds, which are much shorter than short term clouds, we responded to the requests of traders who want to deal with the roller coaster market and
cut the profit quickly.
(Select short-term clouds, short-term clouds, and ultra-short-term clouds to be used for entry and settlement according to the trade style and the 'dissociation between price and moving average'
which varies depending on the brand, time, and market value.)
。According to the calculation of another indicator (LIZ ADX+DMI), the background has become gray synchronously for a period of inactivity and non-trading.
(In such a period, it is often difficult to follow the trend because the market price is difficult even for lower-level ones, and often it is difficult to follow the trend.)
·Many indicators are counted in one, so you can also view the free version of your account, which has three indicators to display.
The moving avarage lines are SMA. ( I have another version which has EMA lines.)
If you are interested in the invitation-only indicator, please contact us on private chat.
各時間足で同じ期間の移動平均線が同じ色で表示できます。
時間足によって見たい複数の移動平均線が表示される他、その時間足で意識すべき期間設定された長期ボリンジャーバンドも表示されます。
1.長期間でかつ多くのトレーダーが意識する期間設定の移動平均線が表示される事で
以下の有益な情報を一目で得る事ができます。
○各時間足に表示される移動平均線の期間設定は、通常のように期間を一定にするの ではなく、期間を時間足毎に変え同色の移動平均線は同じ時間の移動平均線
(例えば1時間平均線、4時間平均線というように。)としてあります。
このため、見る時間足が変わっても、相場を常に同じ尺度で眺める事ができます。
「5分足では上昇トレンドに、4時間足では下落トレンドに見える。」
という事が起こりません。
○表示される移動平均線に対するレートの感応度は非常に高く、移動平均線にレ-ト
が差し掛かると抵抗を受け反発したり移動平均線を抜けると、勢いよくトレンドが
発生するなど、レートの動きがどのようにして決まっているかを実感でき、抽象的
だったチャートの動きにリアリティーを感じる事ができます。
特に1分足から4時間足まで表示される紫24時間(1日)移動平均線、5分足から
日足まで表示される緑1週間移動平均線、5分足から週足まで表示される青1ヶ月
移動平均線、1時間足から週足まで表示される赤1年移動平均線に対する感応度は
非常に高く、それぞれの移動平均線の上下どちらでレートが推移しているかを見る
だけで、買い目線売り目線の決定ができます。
○短々期、短期、中短期、中期、中長期、長期、長々期の7本
(週足だけはそれに加え最長期の8本)の移動平均線がどのような位置関係にあるか
によってトレンドの方向と強さが認識しやすいよう移動平均線間に着色し短期雲、
中期雲として意識できるようになっています。
3つの雲は移動平均線の関係によりそれぞれ暖色の上昇雲、寒色の下落雲に色が変わり、
・全ての雲が上昇下落どちらかに統一されで短期雲、中期雲、長期雲という順に並
んでいる時は強い上昇トレンド相場
・雲の傾きがきつく厚みがしっかりしている、厚みが増している時は強いトレンド相場
・雲が重なったり、各雲の色がまちまちの時はトレンドレス相場
・雲と雲の間をレートが行ったり来たりしている時はレンジ相場
など、視覚的直感的に相場の状況が理解できます。
表示が可能な時間足は1分、5分、15分 30分、60分、4時間、1日、1週間(合計8つ)です。
※Makenai Chart Indicator の上位版です。
・200SMA,200SMAを中心バンドとするボリンジャーバンド±3σが各時間足に共通で表示されるようになりました。
・5分15分30分1時間足短期移動平均線の設定を変更し、短期雲がねじれやすくし、決済タイミングを早めました。
・短期雲よりさらに短い、超短期雲・短々期雲を追加し、ジェットコースター相場への対応、早めに利確・損切りしたいトレーダーの要望に対応しました。
(トレードスタイルに応じ、また銘柄・時間足・相場つきによって変わる『価格と移動平均線との解離』に応じ、エントリー・決済に使う短期雲・短々期雲・超短期雲を選択します。)
・別のインジケーター(LIZ ADX+DMI)の計算による、ボラティティーがなくトレードに向かない期間は、同期して背景がグレーになるようになりました。
(LIZ ADX+DMIの詳細はこちらのリンクからご覧になれます。 )
(そのような期間は下位足でも難しい相場つき、レンジやランダム相場になっている事が多いため、トレンドフォローが難しい可能性が高いです。)
・たくさんのインジケーターが1つにカウントされるため、表示できるインジケーター3つの制限がある、無料版のアカウントをお使いの方も表示できます
移動平均線はSMAです。(EMA線がある別のバージョンがあります)
招待専用インジに興味ある方はプライベートチャットに連絡をください。
リリースノート
・The name of the indicator has been changed.・The period setting of the medium-term Bollinger Bands displayed on each time frame has been changed to a shorter one.
・インジケーターの名称を変更しました。
・各時間足に表示される中期ボリンジャーバンドの期間設定を短いものに変更しました。
リリースノート
Fixed the setting screen.設定画面を修正しました。
招待専用スクリプト
このスクリプトへのアクセスは作者が許可したユーザーに制限されており、通常はお支払いが必要です。お気に入りに追加することはできますが、許可を申請して作者が許可した後でなければ使用することはできません。 詳細については kowatasan にお問い合わせいただくか、以下の作者の指示に従ってください。
スクリプトの動作を理解していて作者も100%信頼できるということでなければ、TradingViewとしてはお金を払ってまでスクリプトを利用するのはお勧めしません。そのかわりに、コミュニティスクリプトでオープンソースの優れたスクリプトが無料で見つけられることが多々あります。
作者の指示
″If you are interested in this indicator, please send me a direct email.
I'll show you how to subscribe.
もしこのインジケーターに興味がある場合はダイレクトメールを送ってください。購読方法をご案内します。
チャートでこのスクリプトを利用したいですか?
注: アクセス権をリクエストされる前にこちらをご覧ください。
1人で悩まず、LINE公式登録
(インジ他無料プレゼント増量)
line.me/ti/p/@211ywenv
ユーチューバー対談
youtube.com/playlist?list=PL2sT2s7dIWWVYNuPLepsNNRRVCjQCqPUV
無料で学べるトレーダーズクラブ
liz-asset-design.com/
TicTokで時短動画配信中
tiktok.com/@akihikokowata
(インジ他無料プレゼント増量)
line.me/ti/p/@211ywenv
ユーチューバー対談
youtube.com/playlist?list=PL2sT2s7dIWWVYNuPLepsNNRRVCjQCqPUV
無料で学べるトレーダーズクラブ
liz-asset-design.com/
TicTokで時短動画配信中
tiktok.com/@akihikokowata
免責事項
これらの情報および投稿は、TradingViewが提供または保証する金融、投資、取引、またはその他の種類のアドバイスや推奨を意図したものではなく、またそのようなものでもありません。詳しくは利用規約をご覧ください。