INVITE-ONLY SCRIPT
更新済 Ekambit Volume Strength Index (EVSI)
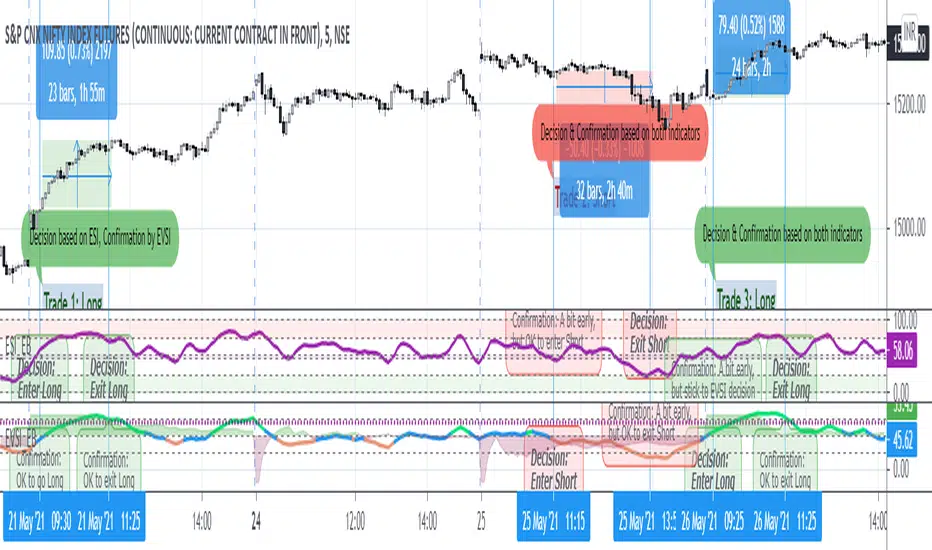
Ekambit Volume Strength Index (EVSI) is an innovative volume strength oscillator, which makes use of long-term historical volume strength as well as real-time volume strength in an easy to use format.
We at Ekambit Technologies use it daily, together with ESI indicator, with consistent success in the Indian and US markets.
This indicator is effective for intraday timeframes as we have backtested as well as deployed on the live market.
Usage:
1) Green & above mid-zone & rising: uptrend
2) Green & falling from high-zone: uptrend reversal
3) Red & below mid-zone & falling: downtrend
4) Red & rising from low-zone: downtrend reversal
5) Blue: transition middle-zone (wait to enter, or exit on opportunity)
For greater conviction before entering a trade, enable the "Show Trend" option, which compares recent volume strength with long-term historical volume strength.
For the above example,
* The purple dotted line (around 65) shows the long term historical volume trend strength.
* The green shaded area indicates that current volume trend strength is around 5% stronger than historical, which should provide greater conviction to the direction shown by EVSI indicator. This delta (recent minus historical) is shown with a base of 50, to align with the middle line of EVSI and provide you with an easy visually perceptible output.
Learning:
Just like price has memory, volume has memory. Volume indicates the collective outcome of all market participants. A larger number of participants makes it easier to predict the volume trend in a probabilistic manner.
Hence Index Futures like ES1!,
ES1!,  NQ1!,
NQ1!,  NIFTY1! and
  BANKNIFTY1! are better suited for volume analysis than individual stocks which can be less liquid, with price more easily influenced by a large buyer or seller.
For Futures which trade almost 24x7, it's better to choose the high volume time periods i.e. when local Equity market is Open, rather than the overnight illiquid time periods.
We at Ekambit Technologies use it daily, together with ESI indicator, with consistent success in the Indian and US markets.
This indicator is effective for intraday timeframes as we have backtested as well as deployed on the live market.
Usage:
1) Green & above mid-zone & rising: uptrend
2) Green & falling from high-zone: uptrend reversal
3) Red & below mid-zone & falling: downtrend
4) Red & rising from low-zone: downtrend reversal
5) Blue: transition middle-zone (wait to enter, or exit on opportunity)
For greater conviction before entering a trade, enable the "Show Trend" option, which compares recent volume strength with long-term historical volume strength.
For the above example,
* The purple dotted line (around 65) shows the long term historical volume trend strength.
* The green shaded area indicates that current volume trend strength is around 5% stronger than historical, which should provide greater conviction to the direction shown by EVSI indicator. This delta (recent minus historical) is shown with a base of 50, to align with the middle line of EVSI and provide you with an easy visually perceptible output.
Learning:
Just like price has memory, volume has memory. Volume indicates the collective outcome of all market participants. A larger number of participants makes it easier to predict the volume trend in a probabilistic manner.
Hence Index Futures like
For Futures which trade almost 24x7, it's better to choose the high volume time periods i.e. when local Equity market is Open, rather than the overnight illiquid time periods.
リリースノート
- Improved EVSI calculation
- Showcase latest example from 28-May-2021
- Show EVSI usage together with ESI indicator, for a stronger conviction for entering and exiting trades
招待専用スクリプト
このスクリプトは作者が承認したユーザーのみアクセス可能です。使用するにはアクセス申請をして許可を得る必要があります。通常は支払い後に承認されます。詳細は下記の作者の指示に従うか、ekambitに直接お問い合わせください。
TradingViewは、作者を完全に信頼し、スクリプトの動作を理解していない限り、有料スクリプトの購入・使用を推奨しません。コミュニティスクリプトには無料のオープンソースの代替が多数あります。
作者の指示
Kindly use the link below to obtain 7-days free access to this indicator, and get more information about its usage and configuration:
https://secure.ekambit.com/evsi/
免責事項
この情報および投稿は、TradingViewが提供または推奨する金融、投資、トレード、その他のアドバイスや推奨を意図するものではなく、それらを構成するものでもありません。詳細は利用規約をご覧ください。