OPEN-SOURCE SCRIPT
更新済 Pi Cycle Oscillator
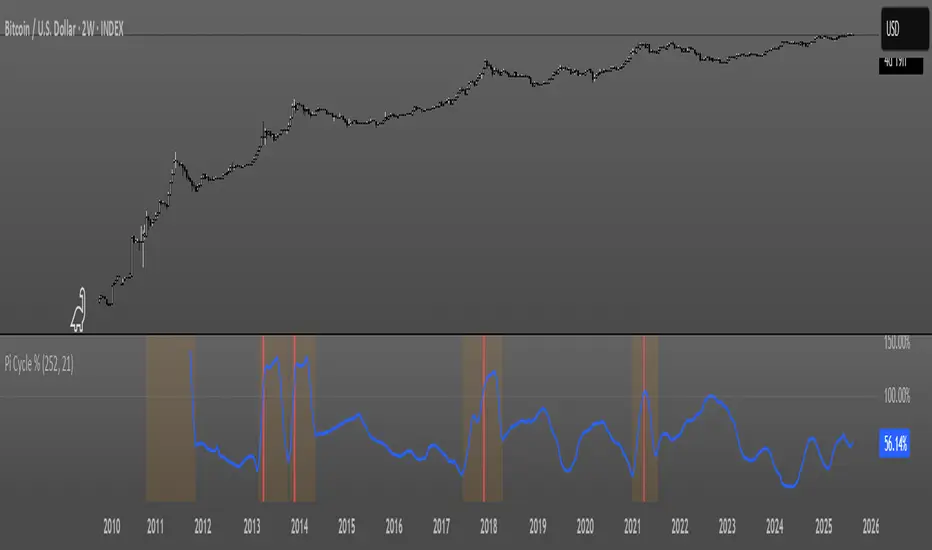
This oscillator combines the Pi Cycle Top indicator with a percentile-based approach to create a more precise and easy to read market timing tool.
Instead of waiting for moving average crossovers, it shows you exactly how close you are to a potential market top.
Orange background means you should start preparing for a potential top and look into taking profits.
Red background means that the crossover has happened on the original Pi Cycle Indicator and that you should have already sold everything. (Crossover of the gray line aka 100)
Thank you
Bollinger Band Width Percentile - The_Caretaker
Pi Cycle Top - megasyl20
リリースノート
Changed signal line from 100 -> 99Advise usage in 1W or lower.
リリースノート
Red background needs "movingTarget > 0"リリースノート
Added the ability to pick between searching for tops or bottoms.オープンソーススクリプト
TradingViewの精神に則り、このスクリプトの作者はコードをオープンソースとして公開してくれました。トレーダーが内容を確認・検証できるようにという配慮です。作者に拍手を送りましょう!無料で利用できますが、コードの再公開はハウスルールに従う必要があります。
免責事項
この情報および投稿は、TradingViewが提供または推奨する金融、投資、トレード、その他のアドバイスや推奨を意図するものではなく、それらを構成するものでもありません。詳細は利用規約をご覧ください。
オープンソーススクリプト
TradingViewの精神に則り、このスクリプトの作者はコードをオープンソースとして公開してくれました。トレーダーが内容を確認・検証できるようにという配慮です。作者に拍手を送りましょう!無料で利用できますが、コードの再公開はハウスルールに従う必要があります。
免責事項
この情報および投稿は、TradingViewが提供または推奨する金融、投資、トレード、その他のアドバイスや推奨を意図するものではなく、それらを構成するものでもありません。詳細は利用規約をご覧ください。