OPEN-SOURCE SCRIPT
更新済 FSVZO | Lyro RS
FSVZO | Lyro RS
This script is a technical analysis tool called the FSVZO, or Fourier Smoothed Volume Zone Oscillator. It is designed to analyze market momentum and trend strength by combining price and volume data with advanced smoothing techniques. The goal is to help identify potential trends, overbought/oversold conditions, and divergence signals in a clear visual format.
Understanding the Indicator's Components
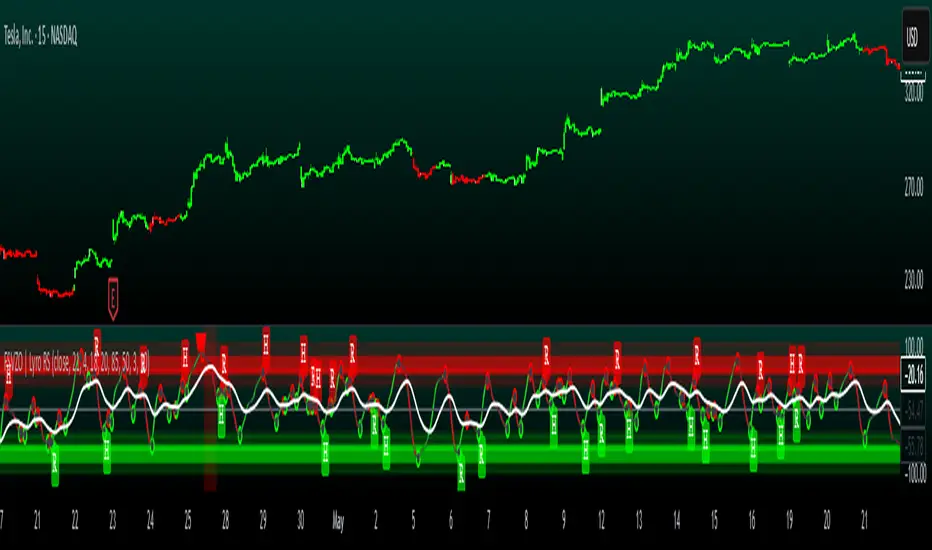
The indicator plots a main oscillator line and several supporting elements on a separate pane below the chart.
The Main Oscillator: This is the primary, colored wave. Its movement and color are key to interpretation.
Trend Direction: The color shifts between bullish and bearish tones based on the momentum of the oscillator. This provides a quick visual reference for the prevailing short-term trend.
Key Levels: Horizontal lines mark significant levels such as +60, +85, -60, and -85. Movements above +60 or below -60 can indicate strong momentum, while approaches to the extreme levels (+85/-85) may suggest overbought or oversold conditions.
Divergence Detection: The indicator can plot labels ("ℝ" for Regular, "ℍ" for Hidden) on the oscillator to signal potential divergences. These occur when the indicator's direction differs from the price action on the main chart and can sometimes foreshadow reversals or continuations.
Moving Average (MA): A central moving average line, based on the oscillator, helps to smooth out the data further and can act as a dynamic support or resistance level within the indicator pane.
White Noise Filter (Optional): This feature displays a histogram that represents market noise. It can be toggled on or off. Analyzing the histogram's behavior may provide additional context on the stability or volatility of the current trend.
Dynamic Background: The background of the indicator pane can change color to highlight periods where the momentum is particularly strong, based on the position of the moving average.
Suggested Use and Interpretation
Traders might use this indicator in several ways:
Trend Identification: Observe the color and position of the main oscillator. A predominantly bullish-colored oscillator above the zero line may suggest an upward trend, while a bearish-colored one below zero may suggest a downward trend.
Signal Confirmation: Look for the oscillator to cross key levels (like +/-40 or +/-60) in the direction of a suspected trend as a confirmation signal.
Divergence Analysis: When the price makes a new high or low that is not confirmed by a new high or low on the FSVZO oscillator (a divergence), it can be a warning of potential weakness in the trend. The "ℝ" and "ℍ" labels help to identify these scenarios.
Extreme Readings: Readings near the +85 or -85 levels can indicate that a price move may be overextended, which could precede a pause or reversal.
Customization Options
The indicator includes settings groups that allow you to adjust its behavior and appearance:
FSVZO Settings: Adjust parameters like Length and Sensitivity to make the oscillator more or less responsive to market movements.
Signals & Display: Modify visual aspects such as Smooth Length and Glowing Amount, or toggle features like the dynamic background on and off.
Colors: Choose from several pre-set color palettes to suit your visual preferences.
⚠️Disclaimer
This indicator is a tool for technical analysis and does not provide guaranteed results. It should be used in conjunction with other analysis methods and proper risk management practices. The creators of this indicator are not responsible for any financial decisions made based on its signals.
This script is a technical analysis tool called the FSVZO, or Fourier Smoothed Volume Zone Oscillator. It is designed to analyze market momentum and trend strength by combining price and volume data with advanced smoothing techniques. The goal is to help identify potential trends, overbought/oversold conditions, and divergence signals in a clear visual format.
Understanding the Indicator's Components
The indicator plots a main oscillator line and several supporting elements on a separate pane below the chart.
The Main Oscillator: This is the primary, colored wave. Its movement and color are key to interpretation.
Trend Direction: The color shifts between bullish and bearish tones based on the momentum of the oscillator. This provides a quick visual reference for the prevailing short-term trend.
Key Levels: Horizontal lines mark significant levels such as +60, +85, -60, and -85. Movements above +60 or below -60 can indicate strong momentum, while approaches to the extreme levels (+85/-85) may suggest overbought or oversold conditions.
Divergence Detection: The indicator can plot labels ("ℝ" for Regular, "ℍ" for Hidden) on the oscillator to signal potential divergences. These occur when the indicator's direction differs from the price action on the main chart and can sometimes foreshadow reversals or continuations.
Moving Average (MA): A central moving average line, based on the oscillator, helps to smooth out the data further and can act as a dynamic support or resistance level within the indicator pane.
White Noise Filter (Optional): This feature displays a histogram that represents market noise. It can be toggled on or off. Analyzing the histogram's behavior may provide additional context on the stability or volatility of the current trend.
Dynamic Background: The background of the indicator pane can change color to highlight periods where the momentum is particularly strong, based on the position of the moving average.
Suggested Use and Interpretation
Traders might use this indicator in several ways:
Trend Identification: Observe the color and position of the main oscillator. A predominantly bullish-colored oscillator above the zero line may suggest an upward trend, while a bearish-colored one below zero may suggest a downward trend.
Signal Confirmation: Look for the oscillator to cross key levels (like +/-40 or +/-60) in the direction of a suspected trend as a confirmation signal.
Divergence Analysis: When the price makes a new high or low that is not confirmed by a new high or low on the FSVZO oscillator (a divergence), it can be a warning of potential weakness in the trend. The "ℝ" and "ℍ" labels help to identify these scenarios.
Extreme Readings: Readings near the +85 or -85 levels can indicate that a price move may be overextended, which could precede a pause or reversal.
Customization Options
The indicator includes settings groups that allow you to adjust its behavior and appearance:
FSVZO Settings: Adjust parameters like Length and Sensitivity to make the oscillator more or less responsive to market movements.
Signals & Display: Modify visual aspects such as Smooth Length and Glowing Amount, or toggle features like the dynamic background on and off.
Colors: Choose from several pre-set color palettes to suit your visual preferences.
⚠️Disclaimer
This indicator is a tool for technical analysis and does not provide guaranteed results. It should be used in conjunction with other analysis methods and proper risk management practices. The creators of this indicator are not responsible for any financial decisions made based on its signals.
リリースノート
Update: Added Plot Color オープンソーススクリプト
TradingViewの精神に則り、このスクリプトの作者はコードをオープンソースとして公開してくれました。トレーダーが内容を確認・検証できるようにという配慮です。作者に拍手を送りましょう!無料で利用できますが、コードの再公開はハウスルールに従う必要があります。
Get access to our private indicators & analysis: whop.com/lyro-rs
Join our community: discord.gg/YUg8UxeRu8
All material from Lyro RS is for educational purposes only. Past performance does not guarantee future results.
Join our community: discord.gg/YUg8UxeRu8
All material from Lyro RS is for educational purposes only. Past performance does not guarantee future results.
免責事項
この情報および投稿は、TradingViewが提供または推奨する金融、投資、トレード、その他のアドバイスや推奨を意図するものではなく、それらを構成するものでもありません。詳細は利用規約をご覧ください。
オープンソーススクリプト
TradingViewの精神に則り、このスクリプトの作者はコードをオープンソースとして公開してくれました。トレーダーが内容を確認・検証できるようにという配慮です。作者に拍手を送りましょう!無料で利用できますが、コードの再公開はハウスルールに従う必要があります。
Get access to our private indicators & analysis: whop.com/lyro-rs
Join our community: discord.gg/YUg8UxeRu8
All material from Lyro RS is for educational purposes only. Past performance does not guarantee future results.
Join our community: discord.gg/YUg8UxeRu8
All material from Lyro RS is for educational purposes only. Past performance does not guarantee future results.
免責事項
この情報および投稿は、TradingViewが提供または推奨する金融、投資、トレード、その他のアドバイスや推奨を意図するものではなく、それらを構成するものでもありません。詳細は利用規約をご覧ください。