OPEN-SOURCE SCRIPT
更新済 StochCMO - Stochastic CMO [SHK]
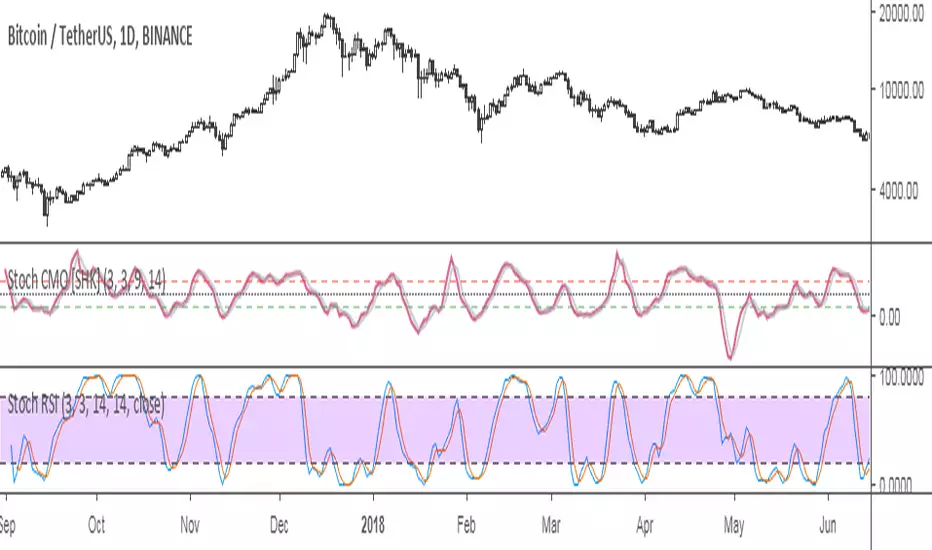
StochCMO is the combination of Stochastic and CMO (Chande Momentum Oscillator).
The StochCMO is an indicator used in technical analysis that ranges between zero and one and is created by applying the Stochastic Oscillator formula to a set of Chande Momentum Oscillator (CMO) values rather than standard price data. Using CMO values within the Stochastic formula gives traders an idea of whether the current CMO value is overbought or oversold - a measure that becomes specifically useful when the CMO value is confined between its signal levels of 20 and 80.
Usage:
The usage of StochCMO is similar to StochRSI.
StochCMO vs StochRSI:
The difference between these indicators can be realized by comparing CMO & RSI:
CMO is similar to the Relative Strength Index (RSI) except that it measures momentum on both up days and down days. The CMO also does not use internal smoothing and thus does not obscure short-term extremes in momentum. As a result, the CMO often reaches over bought and over sold areas more regularly than momentum indicators, such as the RSI, that have internal smoothing.
Hope it helps you.
リリースノート
New Source Codeオープンソーススクリプト
TradingViewの精神に則り、このスクリプトの作者はコードをオープンソースとして公開してくれました。トレーダーが内容を確認・検証できるようにという配慮です。作者に拍手を送りましょう!無料で利用できますが、コードの再公開はハウスルールに従う必要があります。
免責事項
この情報および投稿は、TradingViewが提供または推奨する金融、投資、トレード、その他のアドバイスや推奨を意図するものではなく、それらを構成するものでもありません。詳細は利用規約をご覧ください。
オープンソーススクリプト
TradingViewの精神に則り、このスクリプトの作者はコードをオープンソースとして公開してくれました。トレーダーが内容を確認・検証できるようにという配慮です。作者に拍手を送りましょう!無料で利用できますが、コードの再公開はハウスルールに従う必要があります。
免責事項
この情報および投稿は、TradingViewが提供または推奨する金融、投資、トレード、その他のアドバイスや推奨を意図するものではなく、それらを構成するものでもありません。詳細は利用規約をご覧ください。