OPEN-SOURCE SCRIPT
更新済 BTC Indicator By Megalodon Trading
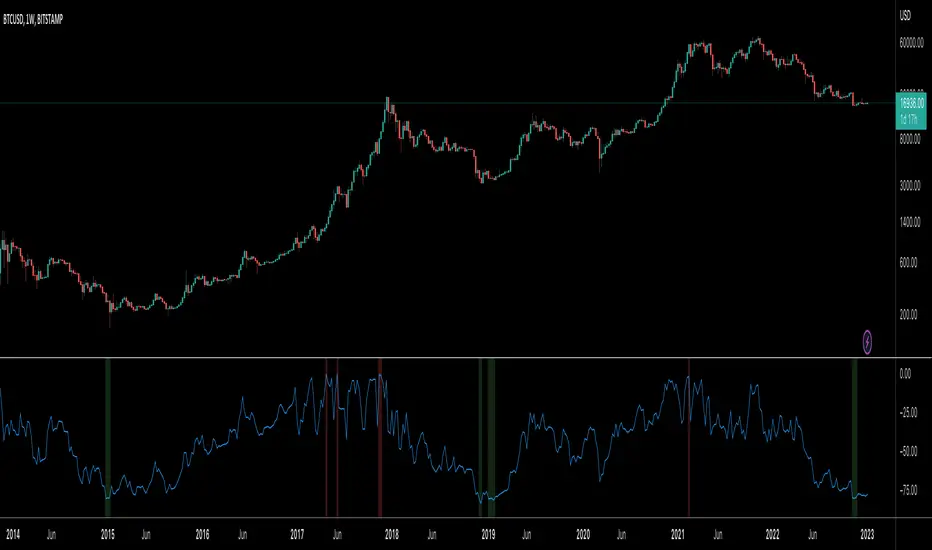
This indicator is designed help you see the potential reversal zones and it helps you accumulate for the long run.
This combines price data on any chart. The chart isolates between 0 and -100. Below -80 is a buy, above -20 is a sell location.
In these locations, try to Slowly Buy and Slowly Sell (accumulate...)
Story Of This Indicator
~I was always obsessed with Fibonacci and used Fibonacci all the time. Thus, i wanted to make a tool to see buying locations and selling locations.
Instead of drawing fibonacci's and manually interpreting buy/sell locations, i wanted algorithms to do the job for me. So, i created this algorithm and many more like it.
If you think i did a good job and want to do further work with me, feel free to contact.
I have a ton of other tools that can change everything for your trading/investing.
Best wishes
~Megalodon
リリースノート
Added new settings for buy and sell levels. オープンソーススクリプト
TradingViewの精神に則り、このスクリプトの作者はコードをオープンソースとして公開してくれました。トレーダーが内容を確認・検証できるようにという配慮です。作者に拍手を送りましょう!無料で利用できますが、コードの再公開はハウスルールに従う必要があります。
Telegram Here t.me/bugrasukas
免責事項
この情報および投稿は、TradingViewが提供または推奨する金融、投資、トレード、その他のアドバイスや推奨を意図するものではなく、それらを構成するものでもありません。詳細は利用規約をご覧ください。
オープンソーススクリプト
TradingViewの精神に則り、このスクリプトの作者はコードをオープンソースとして公開してくれました。トレーダーが内容を確認・検証できるようにという配慮です。作者に拍手を送りましょう!無料で利用できますが、コードの再公開はハウスルールに従う必要があります。
Telegram Here t.me/bugrasukas
免責事項
この情報および投稿は、TradingViewが提供または推奨する金融、投資、トレード、その他のアドバイスや推奨を意図するものではなく、それらを構成するものでもありません。詳細は利用規約をご覧ください。