OPEN-SOURCE SCRIPT
更新済 Moving Average Shift [Quantora]
Title: Moving Average Shift [Quantora]
Description:
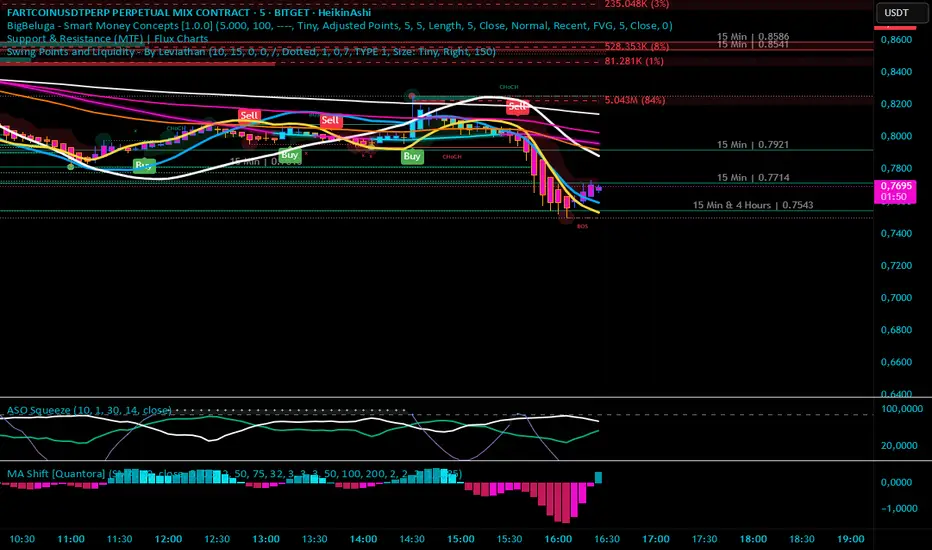
The Moving Average Shift [Quantora] is a dynamic technical analysis tool designed to help traders better visualize trend strength and direction using a combination of customizable moving averages and a volatility-adjusted oscillator.
🔧 Features:
Multi-Type Moving Average Selection
Choose from SMA, EMA, SMMA (RMA), WMA, and VWMA for your main signal line.
ZLSMA Trio
Three Zero-Lag Smoothed Moving Averages (ZLSMA) with adjustable lengths and colors provide a smoother trend-following structure without the delay of traditional MAs.
EMA Ribbon (50/100/200)
Add clarity to long-term trend direction with layered Exponential Moving Averages in key institutional periods.
Volatility-Adjusted Oscillator
A color-changing oscillator calculated from the normalized deviation between price and the selected MA. This helps identify trend shifts and momentum buildups.
Custom MA Line Widths and Styling
Full control over the width and appearance of all MA lines for visual clarity.
Bar & Candle Coloring
Bars and candles dynamically change color based on the relationship between price and the selected MA — helping you quickly assess bullish/bearish conditions.
📈 How It Helps:
Spot early trend shifts through the oscillator.
Confirm trades using the alignment between ZLSMAs and EMAs.
Quickly assess current trend conditions using color-coded price bars.
Description:
The Moving Average Shift [Quantora] is a dynamic technical analysis tool designed to help traders better visualize trend strength and direction using a combination of customizable moving averages and a volatility-adjusted oscillator.
🔧 Features:
Multi-Type Moving Average Selection
Choose from SMA, EMA, SMMA (RMA), WMA, and VWMA for your main signal line.
ZLSMA Trio
Three Zero-Lag Smoothed Moving Averages (ZLSMA) with adjustable lengths and colors provide a smoother trend-following structure without the delay of traditional MAs.
EMA Ribbon (50/100/200)
Add clarity to long-term trend direction with layered Exponential Moving Averages in key institutional periods.
Volatility-Adjusted Oscillator
A color-changing oscillator calculated from the normalized deviation between price and the selected MA. This helps identify trend shifts and momentum buildups.
Custom MA Line Widths and Styling
Full control over the width and appearance of all MA lines for visual clarity.
Bar & Candle Coloring
Bars and candles dynamically change color based on the relationship between price and the selected MA — helping you quickly assess bullish/bearish conditions.
📈 How It Helps:
Spot early trend shifts through the oscillator.
Confirm trades using the alignment between ZLSMAs and EMAs.
Quickly assess current trend conditions using color-coded price bars.
リリースノート
Description:The Moving Average Shift [Quantora] is a dynamic technical analysis tool designed to help traders better visualize trend strength and direction using a combination of customizable moving averages and a volatility-adjusted oscillator.
🔧 Features:
Multi-Type Moving Average Selection
Choose from SMA, EMA, SMMA (RMA), WMA, and VWMA for your main signal line.
ZLSMA Trio
Three Zero-Lag Smoothed Moving Averages (ZLSMA) with adjustable lengths and colors provide a smoother trend-following structure without the delay of traditional MAs.
EMA Ribbon (50/100/200)
Add clarity to long-term trend direction with layered Exponential Moving Averages in key institutional periods.
Volatility-Adjusted Oscillator
A color-changing oscillator calculated from the normalized deviation between price and the selected MA. This helps identify trend shifts and momentum buildups.
Custom MA Line Widths and Styling
Full control over the width and appearance of all MA lines for visual clarity.
Bar & Candle Coloring
Bars and candles dynamically change color based on the relationship between price and the selected MA — helping you quickly assess bullish/bearish conditions.
Chandelier Exit
📈 How It Helps:
Spot early trend shifts through the oscillator.
Confirm trades using the alignment between ZLSMAs and EMAs.
Quickly assess current trend conditions using color-coded price bars.
オープンソーススクリプト
TradingViewの精神に則り、このスクリプトの作者はコードをオープンソースとして公開してくれました。トレーダーが内容を確認・検証できるようにという配慮です。作者に拍手を送りましょう!無料で利用できますが、コードの再公開はハウスルールに従う必要があります。
免責事項
この情報および投稿は、TradingViewが提供または推奨する金融、投資、トレード、その他のアドバイスや推奨を意図するものではなく、それらを構成するものでもありません。詳細は利用規約をご覧ください。
オープンソーススクリプト
TradingViewの精神に則り、このスクリプトの作者はコードをオープンソースとして公開してくれました。トレーダーが内容を確認・検証できるようにという配慮です。作者に拍手を送りましょう!無料で利用できますが、コードの再公開はハウスルールに従う必要があります。
免責事項
この情報および投稿は、TradingViewが提供または推奨する金融、投資、トレード、その他のアドバイスや推奨を意図するものではなく、それらを構成するものでもありません。詳細は利用規約をご覧ください。