OPEN-SOURCE SCRIPT
更新済 MFI Divergence
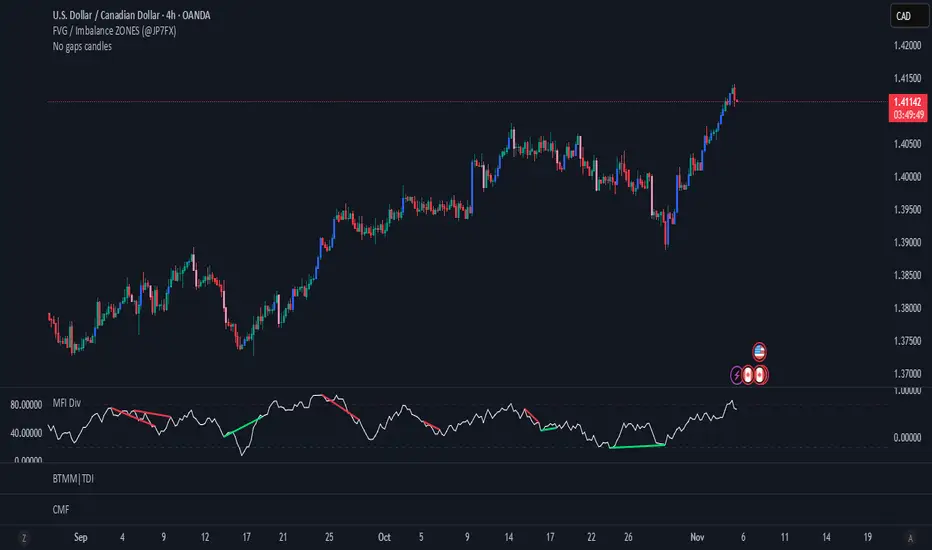
This indicator automatically detects bullish and bearish divergences between price and the Money Flow Index (MFI).
It’s designed for traders who use momentum divergence to anticipate potential trend reversals or continuation traps, and has been optimized to avoid false positives while still catching subtle setups on lower timeframes like 15m.
How It Works
Calculates the Money Flow Index (MFI) using price and volume.
Identifies swing highs and lows on the MFI using adaptive pivot logic.
Compares MFI pivots against corresponding price highs/lows:
Bullish Divergence: Price makes a lower low while MFI makes a higher low.
Bearish Divergence: Price makes a higher high while MFI makes a lower high.
Displays divergences as green (bullish) or red (bearish) lines on the MFI chart.
リリースノート
add center lineオープンソーススクリプト
TradingViewの精神に則り、この作者はスクリプトのソースコードを公開しているので、その内容を理解し検証することができます。作者に感謝です!無料でお使いいただけますが、このコードを投稿に再利用する際にはハウスルールに従うものとします。
免責事項
これらの情報および投稿は、TradingViewが提供または保証する金融、投資、取引、またはその他の種類のアドバイスや推奨を意図したものではなく、またそのようなものでもありません。詳しくは利用規約をご覧ください。
オープンソーススクリプト
TradingViewの精神に則り、この作者はスクリプトのソースコードを公開しているので、その内容を理解し検証することができます。作者に感謝です!無料でお使いいただけますが、このコードを投稿に再利用する際にはハウスルールに従うものとします。
免責事項
これらの情報および投稿は、TradingViewが提供または保証する金融、投資、取引、またはその他の種類のアドバイスや推奨を意図したものではなく、またそのようなものでもありません。詳しくは利用規約をご覧ください。