OPEN-SOURCE SCRIPT
Stable Coin Dominance RSI
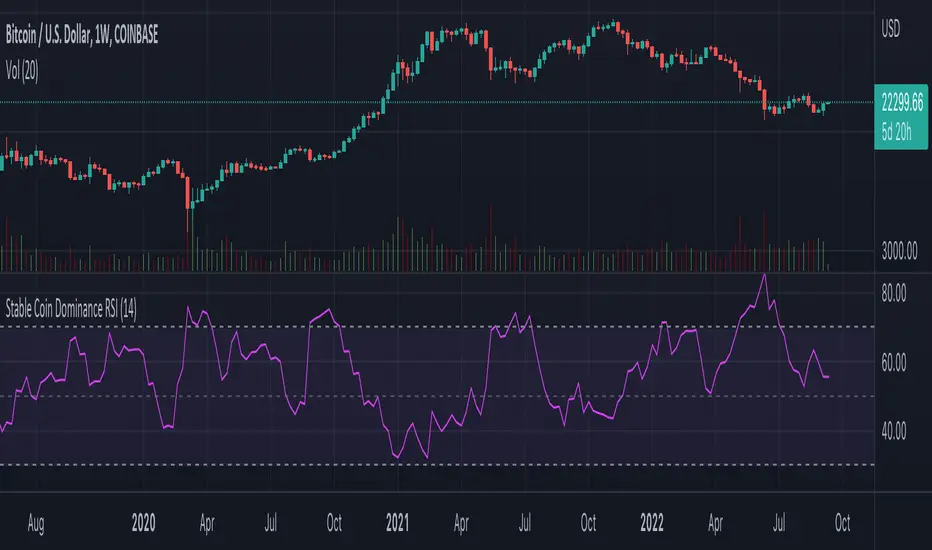
The Stable Coin Dominance RSI evaluates the relative dominance of stable coins within the crypto ecosystem as compared to the total market cap. As stable coin dominance rises, it suggests that market participants are exiting out of crypto assets and into dollar pegged stable coins. The opposite is true inversely; as stable coin dominance diminishes, it suggests that market participants are divesting out of stable coins and into crypto assets.
Stable coin dominance can be expressed as a percentage of the total market cap as follows: Stable Coins / Total Crypto. The Stable Coin Dominance RSI indicator uses this percentage and converts it into an oscillator using the formula for the relative strength index.
The calculation for the indicator is: RSI [ (USDT + USDC) / (BTC + ALTS) ]
The users can select from USDT and USDC, two most dominant stable tokens by market cap, and compare their relative dominance against Bitcoin and the alt market.
The Stable Coin Dominance RSI may be useful on larger timeframes when attempting to identify the market’s appetite for risk along with oversold and undersold readings which may indicate pivots or turn arounds along market extremes.
The limitation of the indicator lies in the fact that stable coins continue to make up a growing percentage of the total market cap over time and thus comparisons to earlier cycles will not be a perfect apples-to-apples evaluation. This being said, the smoothing function of the RSI’s look back helps to moderate these comparative differences.
オープンソーススクリプト
TradingViewの精神に則り、このスクリプトの作者はコードをオープンソースとして公開してくれました。トレーダーが内容を確認・検証できるようにという配慮です。作者に拍手を送りましょう!無料で利用できますが、コードの再公開はハウスルールに従う必要があります。
免責事項
この情報および投稿は、TradingViewが提供または推奨する金融、投資、トレード、その他のアドバイスや推奨を意図するものではなく、それらを構成するものでもありません。詳細は利用規約をご覧ください。
オープンソーススクリプト
TradingViewの精神に則り、このスクリプトの作者はコードをオープンソースとして公開してくれました。トレーダーが内容を確認・検証できるようにという配慮です。作者に拍手を送りましょう!無料で利用できますが、コードの再公開はハウスルールに従う必要があります。
免責事項
この情報および投稿は、TradingViewが提供または推奨する金融、投資、トレード、その他のアドバイスや推奨を意図するものではなく、それらを構成するものでもありません。詳細は利用規約をご覧ください。