OPEN-SOURCE SCRIPT
Glitch Index
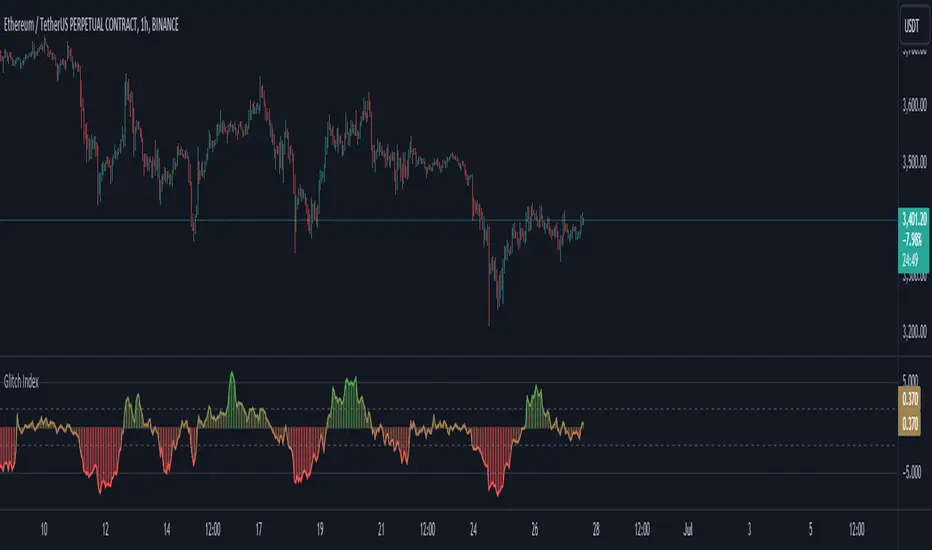
Glitch Index is an oscillator from an unknown origin that is discovered in 2013 as a lua indicator taken from MetaStock days and we are not really sure how far back the original idea goes.
How it Works?
As I found this indicator and looking at it's code in different platform I can see it comes back from a basic idea of getting a price value, calculating it's smoothed average with a set multiplier and getting the difference then presenting it on a simplified scale. It appears to be another interpretation of figuring out price acceleration and velocity. The main logic is calculated as below:
Pine Script®
How to Use?
Glitch Index can be used based on different implementations and along with your already existing trading system as a confirmation. Yoıu can use it as a Long signal when the histogram crosses inner levels or you can use it as an overbough and oversold signals when the histogram crosses above outter levels and gets back in the range between outter and inner levels.
You can customise the settings and set your prefered inner and outter levels in indicator settings along with gradient or static based coloring and modify the code as you see fit. The coloring code is set below:
Pine Script®
How it Works?
As I found this indicator and looking at it's code in different platform I can see it comes back from a basic idea of getting a price value, calculating it's smoothed average with a set multiplier and getting the difference then presenting it on a simplified scale. It appears to be another interpretation of figuring out price acceleration and velocity. The main logic is calculated as below:
price = priceSet(priceType)
_ma = getAverageName(price, MaMethod, MaPeriod)
rocma = ((_ma - _ma[1]) * 0.1) + 1
maMul = _ma * rocma
diff = price - maMul
gli_ind = (diff / price) * -10
How to Use?
Glitch Index can be used based on different implementations and along with your already existing trading system as a confirmation. Yoıu can use it as a Long signal when the histogram crosses inner levels or you can use it as an overbough and oversold signals when the histogram crosses above outter levels and gets back in the range between outter and inner levels.
You can customise the settings and set your prefered inner and outter levels in indicator settings along with gradient or static based coloring and modify the code as you see fit. The coloring code is set below:
gli_col = gli_ind > outterLevel ? color.green : gli_ind < -outterLevel ? color.red : gli_ind > innerLevel ? color.rgb(106, 185, 109, 57) : gli_ind < -innerLevel ? color.rgb(233, 111, 111, 40) : color.new(color.yellow, 60)
gradcol = color.from_gradient(gli_ind, -outterLevel, outterLevel, color.red, color.green)
colorSelect = colorType == "Gradient" ? gradcol : gli_col
オープンソーススクリプト
TradingViewの精神に則り、このスクリプトの作者はコードをオープンソースとして公開してくれました。トレーダーが内容を確認・検証できるようにという配慮です。作者に拍手を送りましょう!無料で利用できますが、コードの再公開はハウスルールに従う必要があります。
One does not simply win every trade.
免責事項
この情報および投稿は、TradingViewが提供または推奨する金融、投資、トレード、その他のアドバイスや推奨を意図するものではなく、それらを構成するものでもありません。詳細は利用規約をご覧ください。
オープンソーススクリプト
TradingViewの精神に則り、このスクリプトの作者はコードをオープンソースとして公開してくれました。トレーダーが内容を確認・検証できるようにという配慮です。作者に拍手を送りましょう!無料で利用できますが、コードの再公開はハウスルールに従う必要があります。
One does not simply win every trade.
免責事項
この情報および投稿は、TradingViewが提供または推奨する金融、投資、トレード、その他のアドバイスや推奨を意図するものではなく、それらを構成するものでもありません。詳細は利用規約をご覧ください。