OPEN-SOURCE SCRIPT
Quartile For Loop [SeerQuant]
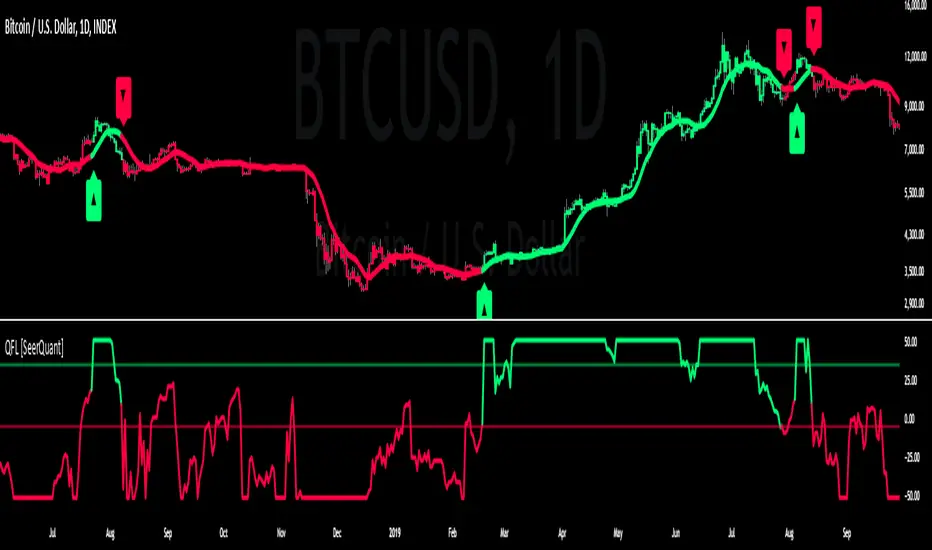
Quartile For Loop (QFL) [SeerQuant]
- The Quartile For Loop (QFL) is an advanced trend-following and scoring oscillator designed to detect momentum shifts and trend transitions using a quartile-based analysis. By leveraging quartile calculations and iterative scoring logic, QFL delivers dynamic trend signals which can be tailored to suit various market conditions.
--------------------------------------------------------------------------------------------------
⚙️ How It Works
1️⃣ Quartile-Based Calculation
The indicator calculates the weighted average of the first quartile (Q1), median (Q2), and third quartile (Q3) over a customizable length, providing a robust adaptive trend value.
2️⃣ For Loop Scoring System
A unique for-loop structure iteratively scores each quartile value against historical data, delivering actionable trend signals. Users can toggle between price-based and quartile-based scoring methods for flexibility.
3️⃣ Threshold Logic
4️⃣ Visual Trend Enhancements
Optional candle coloring and a color-coded SMA provide clear visual cues for identifying trend direction. The adaptive quartile is dynamically updated to reflect changing market conditions.
--------------------------------------------------------------------------------------------------
✨ Customizable Settings
Indicator Inputs
Loop Settings
Style Settings
--------------------------------------------------------------------------------------------------
🚀 Features and Benefits
--------------------------------------------------------------------------------------------------
📜 Disclaimer
This indicator is for educational purposes only and does not constitute financial advice. Market analysis is inherently speculative and subject to risk. Users should consult a licensed financial advisor before making trading decisions. Use at your own discretion.
--------------------------------------------------------------------------------------------------
- The Quartile For Loop (QFL) is an advanced trend-following and scoring oscillator designed to detect momentum shifts and trend transitions using a quartile-based analysis. By leveraging quartile calculations and iterative scoring logic, QFL delivers dynamic trend signals which can be tailored to suit various market conditions.
--------------------------------------------------------------------------------------------------
⚙️ How It Works
1️⃣ Quartile-Based Calculation
The indicator calculates the weighted average of the first quartile (Q1), median (Q2), and third quartile (Q3) over a customizable length, providing a robust adaptive trend value.
2️⃣ For Loop Scoring System
A unique for-loop structure iteratively scores each quartile value against historical data, delivering actionable trend signals. Users can toggle between price-based and quartile-based scoring methods for flexibility.
3️⃣ Threshold Logic
- Bullish (Uptrend): Score exceeds the positive threshold.
- Bearish (Downtrend): Score falls below the negative threshold.
- Neutral: Score remains between thresholds.
4️⃣ Visual Trend Enhancements
Optional candle coloring and a color-coded SMA provide clear visual cues for identifying trend direction. The adaptive quartile is dynamically updated to reflect changing market conditions.
--------------------------------------------------------------------------------------------------
✨ Customizable Settings
Indicator Inputs
- Quartile Length: Define the calculation length for quartile analysis.
- Calculation Source: Choose the data source for quartile calculations (e.g., close price).
- Alternate Signal: Toggle between price-based and quartile-based scoring.
Loop Settings
- Start/End Points: Set the range for the for-loop scoring system.
- Thresholds: Customize uptrend and downtrend thresholds.
Style Settings
- Candle Coloring: Enable optional trend-based candle coloring.
- Color Schemes: Select from five unique palettes for trend visualization.
--------------------------------------------------------------------------------------------------
🚀 Features and Benefits
- Quartile-Driven Analysis: Harnesses the statistical power of quartiles for adaptive trend evaluation.
- Dynamic Scoring: Iterative scoring logic adjusts to market fluctuations.
- Clear Visual Representation: Color-coded histograms, candles, and trendlines enhance readability.
- Fully Customizable: Flexible inputs allow adaptation to diverse trading styles and strategies.
--------------------------------------------------------------------------------------------------
📜 Disclaimer
This indicator is for educational purposes only and does not constitute financial advice. Market analysis is inherently speculative and subject to risk. Users should consult a licensed financial advisor before making trading decisions. Use at your own discretion.
--------------------------------------------------------------------------------------------------
オープンソーススクリプト
TradingViewの精神に則り、このスクリプトの作者はコードをオープンソースとして公開してくれました。トレーダーが内容を確認・検証できるようにという配慮です。作者に拍手を送りましょう!無料で利用できますが、コードの再公開はハウスルールに従う必要があります。
Analytics & Charting Platform 👉 seerquant.org
免責事項
この情報および投稿は、TradingViewが提供または推奨する金融、投資、トレード、その他のアドバイスや推奨を意図するものではなく、それらを構成するものでもありません。詳細は利用規約をご覧ください。
オープンソーススクリプト
TradingViewの精神に則り、このスクリプトの作者はコードをオープンソースとして公開してくれました。トレーダーが内容を確認・検証できるようにという配慮です。作者に拍手を送りましょう!無料で利用できますが、コードの再公開はハウスルールに従う必要があります。
Analytics & Charting Platform 👉 seerquant.org
免責事項
この情報および投稿は、TradingViewが提供または推奨する金融、投資、トレード、その他のアドバイスや推奨を意図するものではなく、それらを構成するものでもありません。詳細は利用規約をご覧ください。