OPEN-SOURCE SCRIPT
更新済 Candle Counter
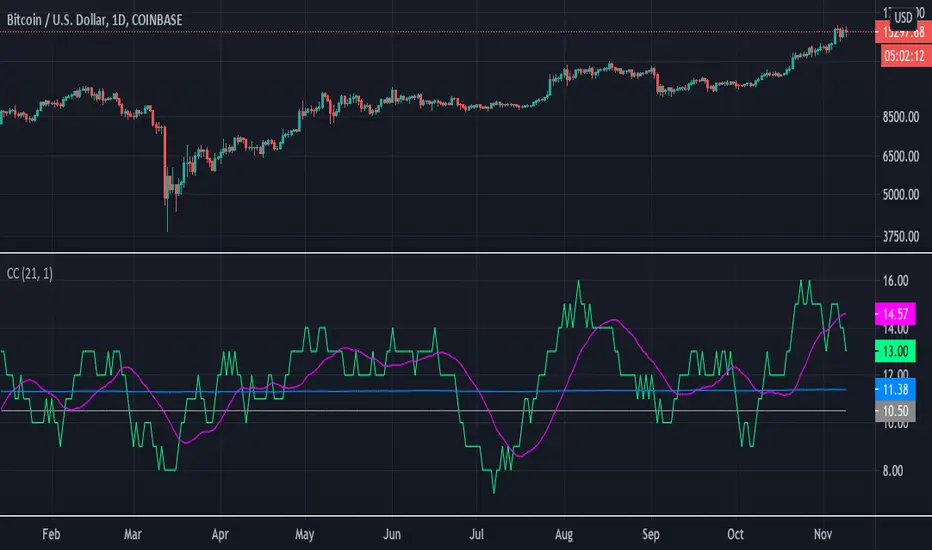
Shows a count of the number of close > open candles over a given range.
- Green line shows the count over the given range.
- Purple line shows the moving average of the green line.
- Grey line is the mean of the range.
Range: Is the amount of candles back to count.
Auto-Smoothing: Is an automatic noise reduction feature.
Smoothing: Is a noise reduction feature of the green line.
Regions below the grey line tend toward over sold territory and region above tend toward over bought.
*** This is not financial advice. Trade at your own risk. Be careful out there.
リリースノート
Added description to comments and removed some old code.
リリースノート
+Adds an "all-time average" which indicates the assets trajectory on the macro scale.
オープンソーススクリプト
TradingViewの精神に則り、このスクリプトの作者はコードをオープンソースとして公開してくれました。トレーダーが内容を確認・検証できるようにという配慮です。作者に拍手を送りましょう!無料で利用できますが、コードの再公開はハウスルールに従う必要があります。
免責事項
この情報および投稿は、TradingViewが提供または推奨する金融、投資、トレード、その他のアドバイスや推奨を意図するものではなく、それらを構成するものでもありません。詳細は利用規約をご覧ください。
オープンソーススクリプト
TradingViewの精神に則り、このスクリプトの作者はコードをオープンソースとして公開してくれました。トレーダーが内容を確認・検証できるようにという配慮です。作者に拍手を送りましょう!無料で利用できますが、コードの再公開はハウスルールに従う必要があります。
免責事項
この情報および投稿は、TradingViewが提供または推奨する金融、投資、トレード、その他のアドバイスや推奨を意図するものではなく、それらを構成するものでもありません。詳細は利用規約をご覧ください。