INVITE-ONLY SCRIPT
更新済 Ghost Vision II
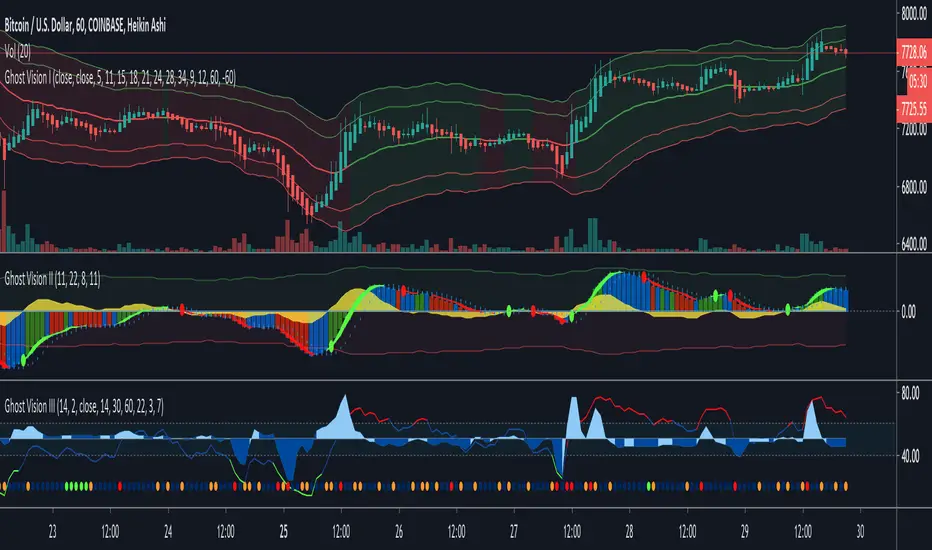
Price action zone — above(green) and below(red) the line is an indication of where the price action is currently at you can also identify the current direction and strength by using the mountains.
Column colors provide feedback with three colors blue, green and red. They have an important function in which they tell you what you shouldn’t be doing against momentum and strength.
GhostVision II — Will answer you for the following questions:
Should you be looking for long or short opportunities?
What is the direction of the current trend?
How strong is the direction of the current trend?
The current trend in a divergence?
Did the trend direction change or about to?
I’m allowed to go short or long now or wait?
リリースノート
Update theme colors for better visibility招待専用スクリプト
このスクリプトは作者が承認したユーザーのみアクセス可能です。使用するにはアクセス申請をして許可を得る必要があります。通常は支払い後に承認されます。詳細は下記の作者の指示に従うか、GhostVisionに直接お問い合わせください。
TradingViewは、作者を完全に信頼し、スクリプトの動作を理解していない限り、有料スクリプトの購入・使用を推奨しません。コミュニティスクリプトには無料のオープンソースの代替が多数あります。
作者の指示
免責事項
この情報および投稿は、TradingViewが提供または推奨する金融、投資、トレード、その他のアドバイスや推奨を意図するものではなく、それらを構成するものでもありません。詳細は利用規約をご覧ください。
招待専用スクリプト
このスクリプトは作者が承認したユーザーのみアクセス可能です。使用するにはアクセス申請をして許可を得る必要があります。通常は支払い後に承認されます。詳細は下記の作者の指示に従うか、GhostVisionに直接お問い合わせください。
TradingViewは、作者を完全に信頼し、スクリプトの動作を理解していない限り、有料スクリプトの購入・使用を推奨しません。コミュニティスクリプトには無料のオープンソースの代替が多数あります。
作者の指示
免責事項
この情報および投稿は、TradingViewが提供または推奨する金融、投資、トレード、その他のアドバイスや推奨を意図するものではなく、それらを構成するものでもありません。詳細は利用規約をご覧ください。