OPEN-SOURCE SCRIPT
Smart MTF Bias Detector v3 (Debug)
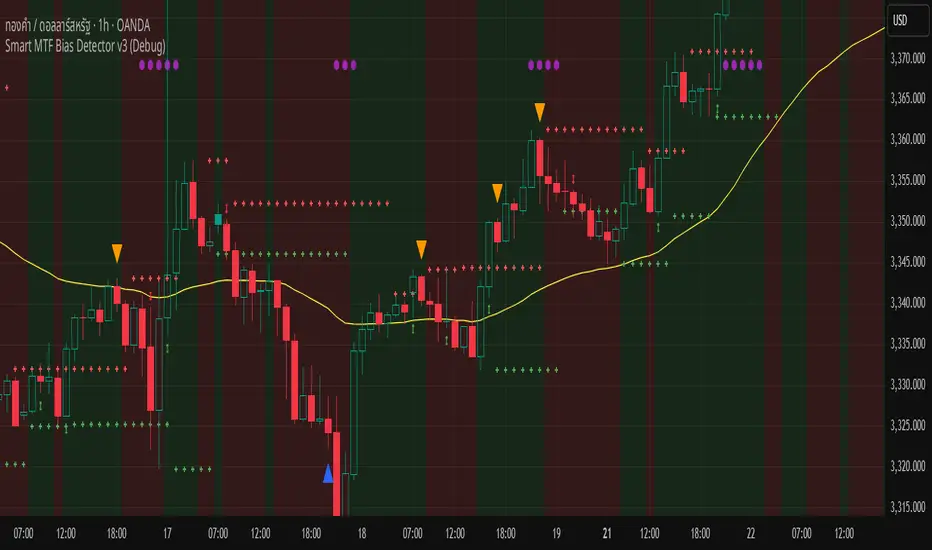
Here's a breakdown of the "Smart MTF Bias Detector v3 (Debug)" indicator's five main filters:
Main Trend (Multi-Timeframe Heikin Ashi)
The green/red background indicates the trend from Heikin Ashi candles on the H1 timeframe (or your set timeframe).
If the Heikin Ashi candle closes above its open, the background is green (indicating an upward bias).
If the Heikin Ashi candle closes below its open, the background is red (indicating a downward bias).
Short-Term Trend Filter (EMA50)
The yellow line represents the EMA50.
Buy only when the price closes above the EMA50.
Sell only when the price closes below the EMA50.
Abnormal Buy/Sell Pressure Detection (Volume Spike)
Purple dots signify candles where the volume is greater than the SMA (Simple Moving Average) of volume over N previous candles, multiplied by a specified multiplier.
This confirms there's "force" driving the price up or serious selling pressure.
Momentum Filter (Stochastic RSI)
Blue upward triangles and orange downward triangles indicate when %K crosses %D.
It uses Oversold/Overbought targets (20/80) to avoid crosses in the middle ranges.
Pivot Break (Fractal Breakout)
Red "X" marks represent Fractal Highs, and green "X" marks represent Fractal Lows.
Red/green up/down arrows indicate breakouts of these levels (e.g., a previous High being broken means an upward breakout, or a previous Low being broken means a downward breakout).
BUY Signal Conditions
A BUY signal will be generated when:
The background is green (HTF Trend ↑).
The Stoch RSI crosses up from below the Oversold zone (blue arrow).
A Fractal Low breakout occurs (Fract UP arrow).
The price is above the EMA50.
There is a Volume Spike (purple dot).
SELL Signal Conditions
A SELL signal will be generated when:
The background is red (HTF Trend ↓).
The Stoch RSI crosses down from above the Overbought zone (orange arrow).
A Fractal High breakout occurs (Fract DOWN arrow).
The price is below the EMA50.
There is a Volume Spike (purple dot).
オープンソーススクリプト
TradingViewの精神に則り、この作者はスクリプトのソースコードを公開しているので、その内容を理解し検証することができます。作者に感謝です!無料でお使いいただけますが、このコードを投稿に再利用する際にはハウスルールに従うものとします。
免責事項
これらの情報および投稿は、TradingViewが提供または保証する金融、投資、取引、またはその他の種類のアドバイスや推奨を意図したものではなく、またそのようなものでもありません。詳しくは利用規約をご覧ください。
オープンソーススクリプト
TradingViewの精神に則り、この作者はスクリプトのソースコードを公開しているので、その内容を理解し検証することができます。作者に感謝です!無料でお使いいただけますが、このコードを投稿に再利用する際にはハウスルールに従うものとします。
免責事項
これらの情報および投稿は、TradingViewが提供または保証する金融、投資、取引、またはその他の種類のアドバイスや推奨を意図したものではなく、またそのようなものでもありません。詳しくは利用規約をご覧ください。