OPEN-SOURCE SCRIPT
更新済 [MAD] Fibchannels
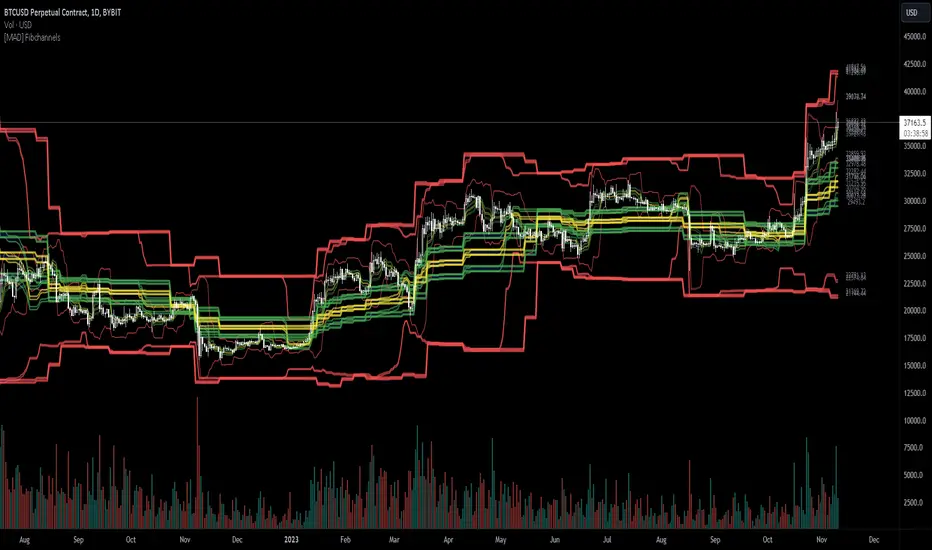
This is an indicator that gives you bands around the Fibonacci levels High/Low of the asset.
There are 3 time frames available so you can use the hourly, daily and weekly at the same time.
You can change the bands via selectable inputs to suit your own preferences.
you can as example combine with RSI or MACD to find a entry
There are 3 time frames available so you can use the hourly, daily and weekly at the same time.
You can change the bands via selectable inputs to suit your own preferences.
you can as example combine with RSI or MACD to find a entry
リリースノート
Added labels and reduction of the securitycallsリリースノート
Bug fixing and some small features:Colors
Transparency for Lines (per Timeframe)
Thickness for Lines (per Timeframe)
Fills configuration is because of lacking more plots still on manual selection
オープンソーススクリプト
TradingViewの精神に則り、このスクリプトの作者はコードをオープンソースとして公開してくれました。トレーダーが内容を確認・検証できるようにという配慮です。作者に拍手を送りましょう!無料で利用できますが、コードの再公開はハウスルールに従う必要があります。
免責事項
この情報および投稿は、TradingViewが提供または推奨する金融、投資、トレード、その他のアドバイスや推奨を意図するものではなく、それらを構成するものでもありません。詳細は利用規約をご覧ください。
オープンソーススクリプト
TradingViewの精神に則り、このスクリプトの作者はコードをオープンソースとして公開してくれました。トレーダーが内容を確認・検証できるようにという配慮です。作者に拍手を送りましょう!無料で利用できますが、コードの再公開はハウスルールに従う必要があります。
免責事項
この情報および投稿は、TradingViewが提供または推奨する金融、投資、トレード、その他のアドバイスや推奨を意図するものではなく、それらを構成するものでもありません。詳細は利用規約をご覧ください。