OPEN-SOURCE SCRIPT
RSI OverBought/Sold Price Predict
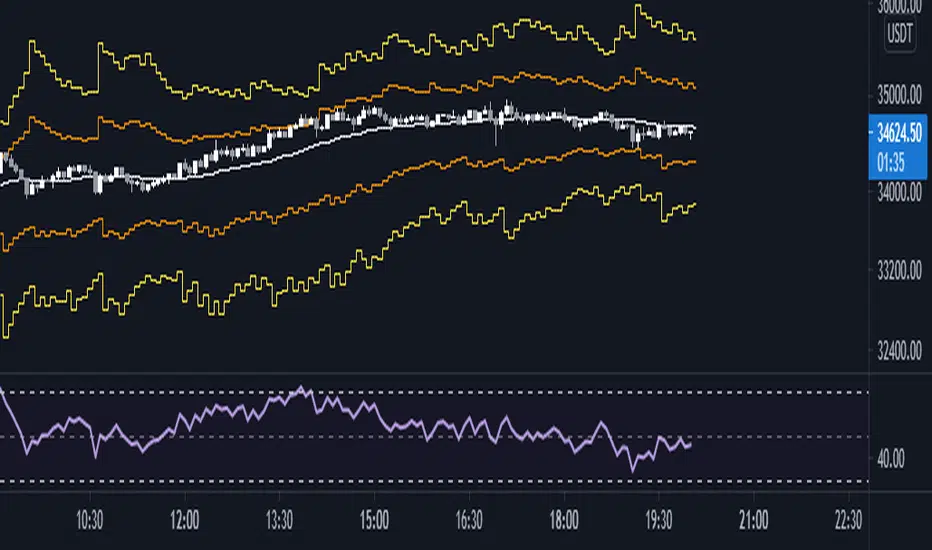
Using the RSI formula, predict what price should be next to be oversold or overbought.
For using support and resistance, turn on "smoothing" option.
White Line = what price should be next to be RSI = 50.
Orange Line = what price should be next to be RSI = 70 or 30 (Default)
Yellow Line = what price should be next to be RSI = 80 or 20 (Default)
Green Line = what price should be next to be RSI = 90 or 10 (Default)
オープンソーススクリプト
TradingViewの精神に則り、このスクリプトの作者はコードをオープンソースとして公開してくれました。トレーダーが内容を確認・検証できるようにという配慮です。作者に拍手を送りましょう!無料で利用できますが、コードの再公開はハウスルールに従う必要があります。
免責事項
この情報および投稿は、TradingViewが提供または推奨する金融、投資、トレード、その他のアドバイスや推奨を意図するものではなく、それらを構成するものでもありません。詳細は利用規約をご覧ください。
オープンソーススクリプト
TradingViewの精神に則り、このスクリプトの作者はコードをオープンソースとして公開してくれました。トレーダーが内容を確認・検証できるようにという配慮です。作者に拍手を送りましょう!無料で利用できますが、コードの再公開はハウスルールに従う必要があります。
免責事項
この情報および投稿は、TradingViewが提供または推奨する金融、投資、トレード、その他のアドバイスや推奨を意図するものではなく、それらを構成するものでもありません。詳細は利用規約をご覧ください。