OPEN-SOURCE SCRIPT
MCDX_Signal
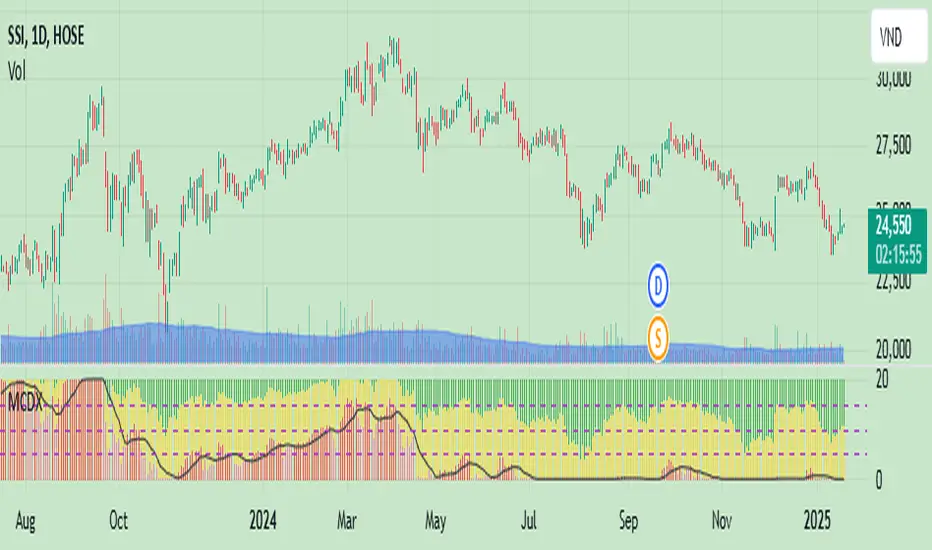
The MCDX indicator (Market Cycle Dynamic Index) is a technical indicator developed by Trung Pham. It is a tool used for analyzing the stock market, often utilized to identify big money flow (Big Money) and evaluate the strength of individual stocks or the overall market.
MCDX is known for its distinctive histogram chart with red and green bars. The red bars typically represent the inflow of big money, while the green bars indicate small money flow or outflows.
MCDX is known for its distinctive histogram chart with red and green bars. The red bars typically represent the inflow of big money, while the green bars indicate small money flow or outflows.
オープンソーススクリプト
TradingViewの精神に則り、このスクリプトの作者はコードをオープンソースとして公開してくれました。トレーダーが内容を確認・検証できるようにという配慮です。作者に拍手を送りましょう!無料で利用できますが、コードの再公開はハウスルールに従う必要があります。
免責事項
この情報および投稿は、TradingViewが提供または推奨する金融、投資、トレード、その他のアドバイスや推奨を意図するものではなく、それらを構成するものでもありません。詳細は利用規約をご覧ください。
オープンソーススクリプト
TradingViewの精神に則り、このスクリプトの作者はコードをオープンソースとして公開してくれました。トレーダーが内容を確認・検証できるようにという配慮です。作者に拍手を送りましょう!無料で利用できますが、コードの再公開はハウスルールに従う必要があります。
免責事項
この情報および投稿は、TradingViewが提供または推奨する金融、投資、トレード、その他のアドバイスや推奨を意図するものではなく、それらを構成するものでもありません。詳細は利用規約をご覧ください。