INVITE-ONLY SCRIPT
Thunderbird PoC

What kind of traders/investors are we?
We are trend followers. Our scripts are designed to be used on the higher timeframes (daily/weekly/monthly) to catch significant moves/trends in the market. While many are aware of the power of trend following, not all have the tools to execute it effectively. Our scripts are tailored to pinpoint and capitalise on long-term market trends.
What does this script do?
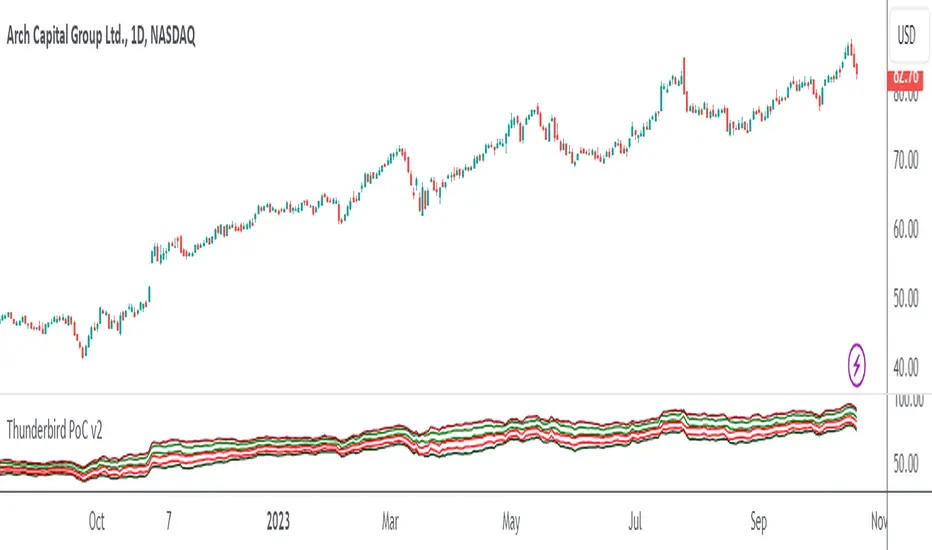
The Thunderbird PoC is a tool for investors looking to capitalise on breakout opportunities. When a breakout of the Donchian occurs, the script produces a signal. This signal is then used to display the entry, stop, and compound levels in the data window. One of its standout features is its ability to show levels for the bar where the mouse is hovering. This allows investors to analyse entry levels from past signals retrospectively. All this information is also conveniently displayed in the data window.
How is the PoC produced?
The PoC is meticulously calculated using a formula the encapsulates ATR. Upon a breakout signal, an entry-level is determined. For a bullish breakout, the entry is set a fixed % leve above the high, and for a bearish breakout, at a fixed % level below. The stop loss level is then calculated by using the ATR formula below the entry for long positions and above for short positions. The compound level is also set using an ATR formula above the entry for long positions and below for short ones.
What is the best timeframe to use the script?
The Thunderbird PoC is optimised for the daily timeframe. This is where the breakout signals are most effective and reliable. By focusing on the daily timeframe, investors can capture significant market movements and avoid the noise of shorter timeframes.
What makes this script unique?
The Thunderbird PoC stands out in its ability to provide investors with a retrospective view of the market. By allowing users to see the levels for the bar where the mouse is, it offers a unique perspective on past signals, enabling investors to learn and adapt from historical data. This feature, combined with its detailed display in the data window, makes it an invaluable tool for those looking to use trend-following techniques.
This tool removes the need of manually having to calculate the entry, stop loss, compound and risk-free levels yourself.
This script has been coded specifically for the daily timeframe to:
This entry signal script helps investors focus on the quality of a potential position when investing in long-term market trends.
We are trend followers. Our scripts are designed to be used on the higher timeframes (daily/weekly/monthly) to catch significant moves/trends in the market. While many are aware of the power of trend following, not all have the tools to execute it effectively. Our scripts are tailored to pinpoint and capitalise on long-term market trends.
What does this script do?
The Thunderbird PoC is a tool for investors looking to capitalise on breakout opportunities. When a breakout of the Donchian occurs, the script produces a signal. This signal is then used to display the entry, stop, and compound levels in the data window. One of its standout features is its ability to show levels for the bar where the mouse is hovering. This allows investors to analyse entry levels from past signals retrospectively. All this information is also conveniently displayed in the data window.
How is the PoC produced?
The PoC is meticulously calculated using a formula the encapsulates ATR. Upon a breakout signal, an entry-level is determined. For a bullish breakout, the entry is set a fixed % leve above the high, and for a bearish breakout, at a fixed % level below. The stop loss level is then calculated by using the ATR formula below the entry for long positions and above for short positions. The compound level is also set using an ATR formula above the entry for long positions and below for short ones.
What is the best timeframe to use the script?
The Thunderbird PoC is optimised for the daily timeframe. This is where the breakout signals are most effective and reliable. By focusing on the daily timeframe, investors can capture significant market movements and avoid the noise of shorter timeframes.
What makes this script unique?
The Thunderbird PoC stands out in its ability to provide investors with a retrospective view of the market. By allowing users to see the levels for the bar where the mouse is, it offers a unique perspective on past signals, enabling investors to learn and adapt from historical data. This feature, combined with its detailed display in the data window, makes it an invaluable tool for those looking to use trend-following techniques.
This tool removes the need of manually having to calculate the entry, stop loss, compound and risk-free levels yourself.
This script has been coded specifically for the daily timeframe to:
- Highlight the start of potential long-term trends.
- Confirm entry points at the end of the trading day, absorbing intraday noise.
- Reduce fake breakouts in a trend.
- Continue to create entry points as the trend develops to allow for compounding.
- Filter out breakouts in a sideways market.
This entry signal script helps investors focus on the quality of a potential position when investing in long-term market trends.
招待専用スクリプト
このスクリプトへのアクセスは作者が許可したユーザーに制限されており、通常はお支払いが必要です。お気に入りに追加することはできますが、許可を申請して作者が許可した後でなければ使用することはできません。 詳細については Sublime_Trading にお問い合わせいただくか、以下の作者の指示に従ってください。
スクリプトの動作を理解していて作者も100%信頼できるということでなければ、TradingViewとしてはお金を払ってまでスクリプトを利用するのはお勧めしません。そのかわりに、コミュニティスクリプトでオープンソースの優れたスクリプトが無料で見つけられることが多々あります。
作者の指示
″This is a tool for Sublime Trading community members only. If you DM us your email, we will send you details on joining the community.
チャートでこのスクリプトを利用したいですか?
注: アクセス権をリクエストされる前にこちらをご覧ください。
Join Our Private Community
bit.ly/join-ST-community
Plus Get Our Ultimate Stock Market Blueprint.
bit.ly/join-ST-community
Plus Get Our Ultimate Stock Market Blueprint.
免責事項
これらの情報および投稿は、TradingViewが提供または保証する金融、投資、取引、またはその他の種類のアドバイスや推奨を意図したものではなく、またそのようなものでもありません。詳しくは利用規約をご覧ください。