OPEN-SOURCE SCRIPT
Abacus Community Williams %R + Bollinger %B

📌 Indicator Description (Professional & Clear)
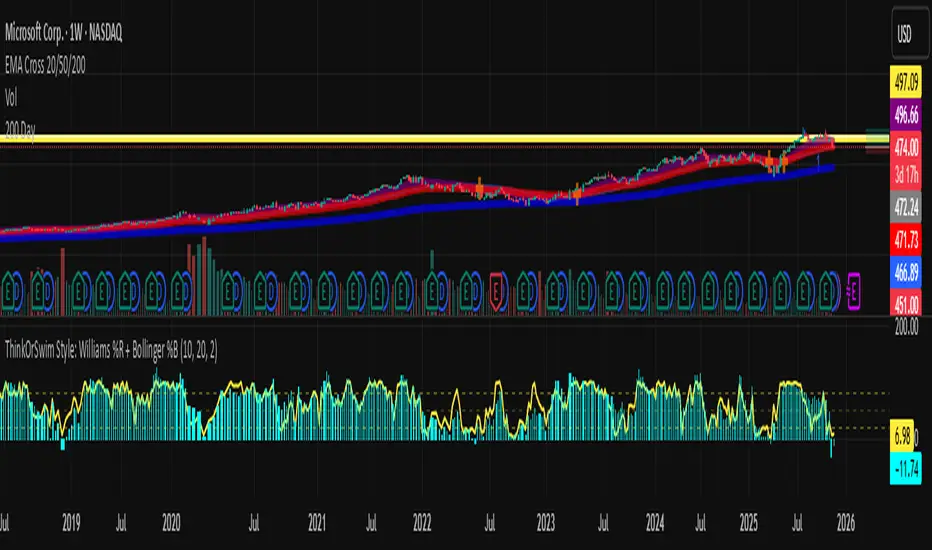
Williams %R + Bollinger %B Momentum Indicator (ThinkOrSwim Style)
This custom indicator combines Williams %R and Bollinger %B into a single, unified panel to provide a powerful momentum-and-positioning view of price action. Modeled after the ThinkOrSwim version used by professional traders, it displays:
✅ Williams %R (10-period) – Yellow Line
This oscillator measures the market's position relative to recent highs and lows.
It plots on a 0% to 100% scale, where:
80–100% → Overbought region
20–0% → Oversold region
50% → Momentum equilibrium
Williams %R helps identify exhaustion, trend strength, and potential reversal zones.
✅ Bollinger %B (20, 2.0) – Turquoise Histogram Bars
%B shows where price is trading relative to the Bollinger Bands:
Above 50% → Price is in the upper half of the band (bullish pressure)
Below 50% → Price is in the lower half (bearish pressure)
Near 100% → Price pushing upper band (possible breakout)
Near 0% → Price testing lower band (possible breakdown)
The histogram visually represents momentum shifts in real time, creating a clean profile of volatility and strength.
🎯 Why This Combination Works
Together, Williams %R and Bollinger %B reveal:
Momentum direction
Overbought/oversold conditions
Volatility compression & expansion
Trend continuation vs reversal zones
High-probability inflection points
Williams %R shows oscillation and exhaustion, while %B shows pressure inside volatility bands.
The combination helps identify whether momentum supports the current trend or is weakening.
🔍 Use Cases
Detect early trend reversals
Validate breakouts and breakdowns
Spot momentum failure in price extremes
Confirm pullbacks and continuation setups
Time entries and exits with higher precision
💡 Best For
Swing traders
Momentum traders
Trend-followers
Options traders (for timing premium decay or volatility expansion)
オープンソーススクリプト
TradingViewの精神に則り、このスクリプトの作者はコードをオープンソースとして公開してくれました。トレーダーが内容を確認・検証できるようにという配慮です。作者に拍手を送りましょう!無料で利用できますが、コードの再公開はハウスルールに従う必要があります。
免責事項
この情報および投稿は、TradingViewが提供または推奨する金融、投資、トレード、その他のアドバイスや推奨を意図するものではなく、それらを構成するものでもありません。詳細は利用規約をご覧ください。
オープンソーススクリプト
TradingViewの精神に則り、このスクリプトの作者はコードをオープンソースとして公開してくれました。トレーダーが内容を確認・検証できるようにという配慮です。作者に拍手を送りましょう!無料で利用できますが、コードの再公開はハウスルールに従う必要があります。
免責事項
この情報および投稿は、TradingViewが提供または推奨する金融、投資、トレード、その他のアドバイスや推奨を意図するものではなく、それらを構成するものでもありません。詳細は利用規約をご覧ください。