OPEN-SOURCE SCRIPT
更新済 Daily RTH Moving Average On Intraday Timeframes [vnhilton]
This indicator is intended for intraday use from the daily timeframe down to the 1 minute. Outside this range, the indicator won't work as intended.
Higher timeframe moving averages are step-lines as they use values from higher timeframes to calculate the moving average. To have a smoother moving average from higher timeframes plotted on lower timeframes, this indicator uses the chart timeframe's candles, allowing for a smooth higher timeframe moving average. This indicator also includes Bollinger Bands. Note that the indicator only uses values from regular trading hours, as to not give weighting to values from extended trading hours.
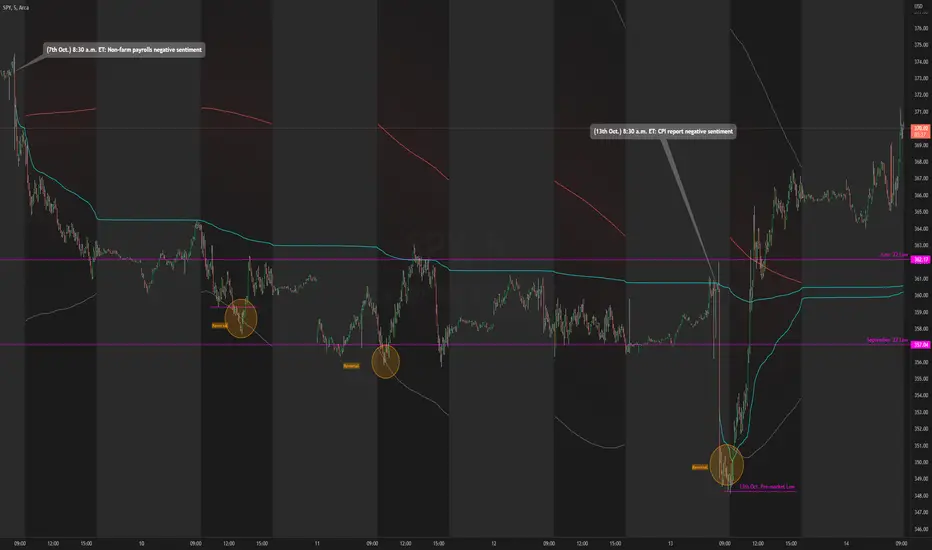
In the chart above, at October 7th, pre-market price action is bearish due to fundamentals around US employment data. This day led to an all-day-fader, stopping above the June low after attempting to break down the level again (previous breakdown attempts led to the September low). Note that the price is within the Bollinger bands of the 5 day moving average. We can see in the following days that SPY trended downwards, staying below the anchored VWAP when the October 7th news released, & pay attention to October 10th, where price attempts to make a new low-of-day but ends up outside the 5 day period ma, leading to a reversal. Look at October 13th, where pre-market price action again shows bearish sentiment, but due to fundamentals around CPI data. SPY opens below the September low, but also ends up outside the daily 5 period MA bands, meaning that the downside extension has extended too far, signalling for a reversion to the mean. This is why October 13th didn't lead to another all-day-fader, & instead trapped sellers trying to short the pre-market low, helping to fuel the relief rally to cause the upsides the June & September lows, & the anchored VWAPs from both significant pre-market events, to be reclaimed, where price pauses at the confluence of the 5 day moving average & the June low.
Higher timeframe moving averages are step-lines as they use values from higher timeframes to calculate the moving average. To have a smoother moving average from higher timeframes plotted on lower timeframes, this indicator uses the chart timeframe's candles, allowing for a smooth higher timeframe moving average. This indicator also includes Bollinger Bands. Note that the indicator only uses values from regular trading hours, as to not give weighting to values from extended trading hours.
In the chart above, at October 7th, pre-market price action is bearish due to fundamentals around US employment data. This day led to an all-day-fader, stopping above the June low after attempting to break down the level again (previous breakdown attempts led to the September low). Note that the price is within the Bollinger bands of the 5 day moving average. We can see in the following days that
リリースノート
Fixed bollinger band calculationsオープンソーススクリプト
TradingViewの精神に則り、このスクリプトの作者はコードをオープンソースとして公開してくれました。トレーダーが内容を確認・検証できるようにという配慮です。作者に拍手を送りましょう!無料で利用できますが、コードの再公開はハウスルールに従う必要があります。
免責事項
この情報および投稿は、TradingViewが提供または推奨する金融、投資、トレード、その他のアドバイスや推奨を意図するものではなく、それらを構成するものでもありません。詳細は利用規約をご覧ください。
オープンソーススクリプト
TradingViewの精神に則り、このスクリプトの作者はコードをオープンソースとして公開してくれました。トレーダーが内容を確認・検証できるようにという配慮です。作者に拍手を送りましょう!無料で利用できますが、コードの再公開はハウスルールに従う必要があります。
免責事項
この情報および投稿は、TradingViewが提供または推奨する金融、投資、トレード、その他のアドバイスや推奨を意図するものではなく、それらを構成するものでもありません。詳細は利用規約をご覧ください。