OPEN-SOURCE SCRIPT
更新済 Expected Z-Scored Price
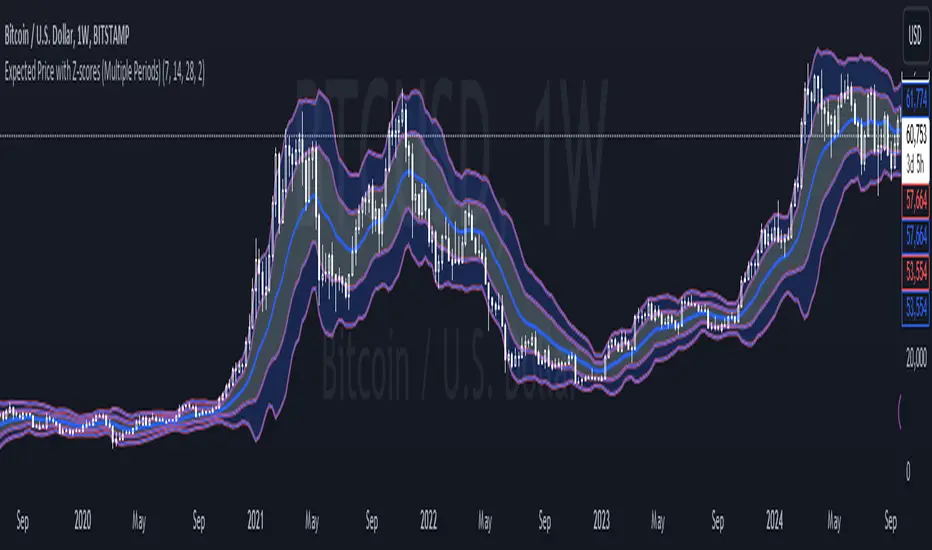
Expected Z-Scored Price is a Mean Reversion based indicator, it shows you where the price should be based on its average price and its average increase over the set previous period, indicating whether the price is under/overvalued giving a unique insight into the current value of an asset, for example  BTCUSD , however is designed for all assets that move in price.
How to read the Expected Z-scored price?
1. Zoom closer, you will see a line in the middle, this is where the price should be based on its average price and its movement
2. The lines above/below are the Standard Deviations (SD) of this expected price, if the price is in the lower price bands or even below them, it is undervalued and it is time to buy/accumulate it, if the price is above the mean (average) price, it is undervalued and should be sold.
It is that easy!
!WATCH OUT!
- This is not a Trend Following indicator, it does not indicate the prices direction, therefore if the asset is undervalued it can still go down, the bands indicate the significancy of the under/overvalueness
- It is not 100% accurate
- Watch out for the significancy of the undervalue or overvalue
Bit more info
- Each line is one SD away from the mean
- Adjusting the timeframe will help you keep the mean and its SDs on the signal period you want them to
- You can adjust the color, thickness of the lines and bands in settings
リリースノート
NEW MINI UPDATE!Now one of components of Expected price Z-score is an average of 3 periods, that will be adjustable
オープンソーススクリプト
TradingViewの精神に則り、この作者はスクリプトのソースコードを公開しているので、その内容を理解し検証することができます。作者に感謝です!無料でお使いいただけますが、このコードを投稿に再利用する際にはハウスルールに従うものとします。
免責事項
これらの情報および投稿は、TradingViewが提供または保証する金融、投資、取引、またはその他の種類のアドバイスや推奨を意図したものではなく、またそのようなものでもありません。詳しくは利用規約をご覧ください。
オープンソーススクリプト
TradingViewの精神に則り、この作者はスクリプトのソースコードを公開しているので、その内容を理解し検証することができます。作者に感謝です!無料でお使いいただけますが、このコードを投稿に再利用する際にはハウスルールに従うものとします。
免責事項
これらの情報および投稿は、TradingViewが提供または保証する金融、投資、取引、またはその他の種類のアドバイスや推奨を意図したものではなく、またそのようなものでもありません。詳しくは利用規約をご覧ください。