OPEN-SOURCE SCRIPT
Market Session Times and Volume [Market Spotter]
Market Session Times and Volume
Market Session Times
Inputs
The inputs tab consists of timezone adjustment which would be the chosen timezone for the plotting of the market sessions based on the market timings.
Further it contains settings for each box to show/hide and change box colour and timings for Asian, London and New York Sessions.

How it works
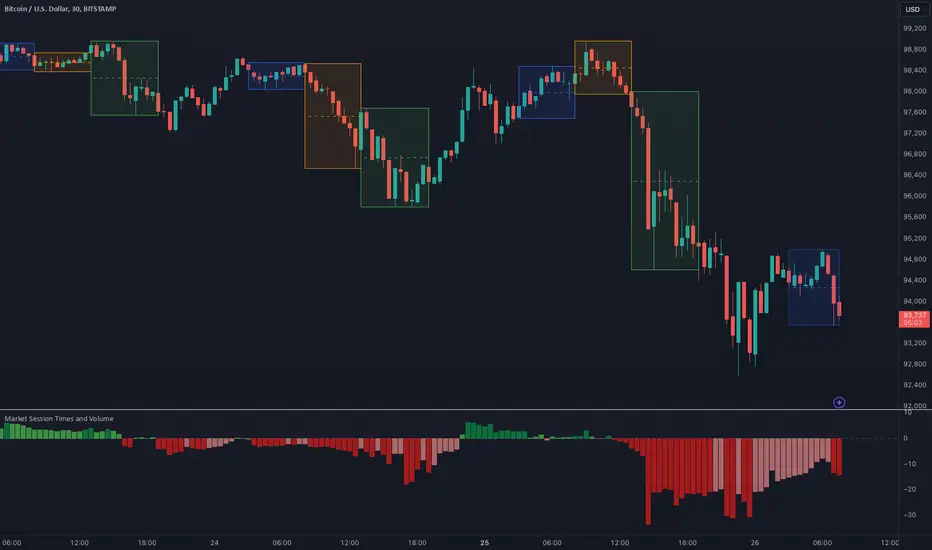
The indicator primarily works by marking the session highs and lows for the chosen time in the inputs, each of the sessions can be input a custom time value which would plot the box. It helps to identify the important price levels and the trading range for each individual session.
The midpoint of each session is marked with a dashed line. The indicator also marks a developing session while it being formed as well to identify potential secondary levels.
Usage
It can be used to trade session breakouts, false breaks and also divide the daily movement into parts and identify possible patterns while trading.
2. Volumes
Inputs
The volume part has 2 inputs - Smoothing and Normalisation. The smoothing period can simply be used to take in charge volumes of last X bars and normalisation can be used for calculating relative volumes based on last Y bars.

How it works
The indicator takes into account the buy and sell volumes of last X bars and then displays that as a relative smoothed volume which helps to identify longer term build or distribution of volume. It plots the positive volume from 0 to 100 and negative volume from 0 to -100 which has been normalised. The colors identify gradual increase or decrease in volumes
Usage
It can also be used to trade volume spikes well and can identify potential market shifts
Market Session Times
Inputs
The inputs tab consists of timezone adjustment which would be the chosen timezone for the plotting of the market sessions based on the market timings.
Further it contains settings for each box to show/hide and change box colour and timings for Asian, London and New York Sessions.
How it works
The indicator primarily works by marking the session highs and lows for the chosen time in the inputs, each of the sessions can be input a custom time value which would plot the box. It helps to identify the important price levels and the trading range for each individual session.
The midpoint of each session is marked with a dashed line. The indicator also marks a developing session while it being formed as well to identify potential secondary levels.
Usage
It can be used to trade session breakouts, false breaks and also divide the daily movement into parts and identify possible patterns while trading.
2. Volumes
Inputs
The volume part has 2 inputs - Smoothing and Normalisation. The smoothing period can simply be used to take in charge volumes of last X bars and normalisation can be used for calculating relative volumes based on last Y bars.
How it works
The indicator takes into account the buy and sell volumes of last X bars and then displays that as a relative smoothed volume which helps to identify longer term build or distribution of volume. It plots the positive volume from 0 to 100 and negative volume from 0 to -100 which has been normalised. The colors identify gradual increase or decrease in volumes
Usage
It can also be used to trade volume spikes well and can identify potential market shifts
オープンソーススクリプト
TradingViewの精神に則り、このスクリプトの作者はコードをオープンソースとして公開してくれました。トレーダーが内容を確認・検証できるようにという配慮です。作者に拍手を送りましょう!無料で利用できますが、コードの再公開はハウスルールに従う必要があります。
免責事項
この情報および投稿は、TradingViewが提供または推奨する金融、投資、トレード、その他のアドバイスや推奨を意図するものではなく、それらを構成するものでもありません。詳細は利用規約をご覧ください。
オープンソーススクリプト
TradingViewの精神に則り、このスクリプトの作者はコードをオープンソースとして公開してくれました。トレーダーが内容を確認・検証できるようにという配慮です。作者に拍手を送りましょう!無料で利用できますが、コードの再公開はハウスルールに従う必要があります。
免責事項
この情報および投稿は、TradingViewが提供または推奨する金融、投資、トレード、その他のアドバイスや推奨を意図するものではなく、それらを構成するものでもありません。詳細は利用規約をご覧ください。