INVITE-ONLY SCRIPT
High and Low Predictor
What can I Do:
Update at 12:01 AM everyday.
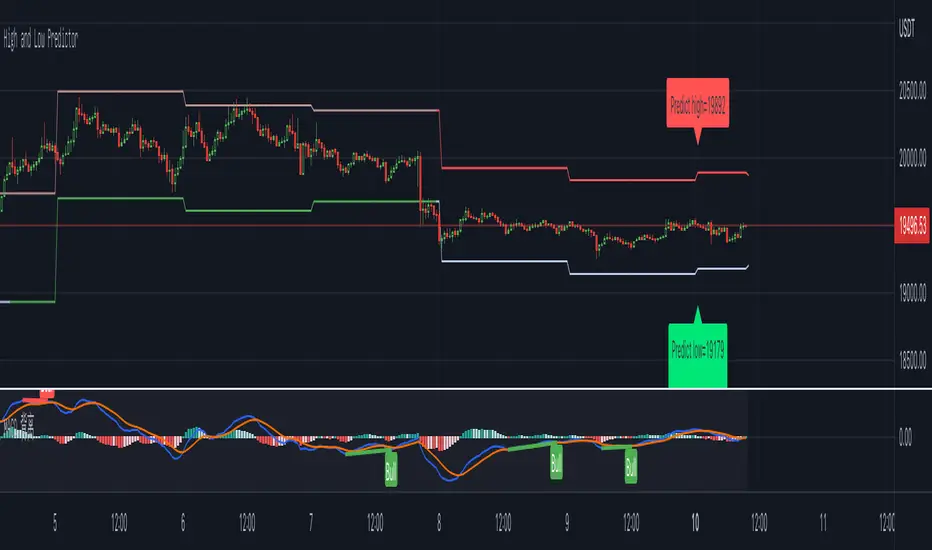
Predict the Highest and the Lowest price of each day.
Color of the lines: the red color suggests downward while the green color suggests upward.
It is able to predict the highest and the lowest price of each day by calculating the history prices,
but please notice this is only prediction! Not one hundred percent correct!
The data suggests chances to buy and to sell, and the history data is also available for review.
If the switch of resistance is turned on, the resistance will be displayed on the chart directly for reference.
How to use it?
First, choose the period of 60 minutes/1 hour,
Second, add alerts, when price hits the predicted prices, it will send you alert alarm.
Update at 12:01 AM everyday.
Predict the Highest and the Lowest price of each day.
Color of the lines: the red color suggests downward while the green color suggests upward.
It is able to predict the highest and the lowest price of each day by calculating the history prices,
but please notice this is only prediction! Not one hundred percent correct!
The data suggests chances to buy and to sell, and the history data is also available for review.
If the switch of resistance is turned on, the resistance will be displayed on the chart directly for reference.
How to use it?
First, choose the period of 60 minutes/1 hour,
Second, add alerts, when price hits the predicted prices, it will send you alert alarm.
招待専用スクリプト
このスクリプトへのアクセスは作者が許可したユーザーに制限されており、通常はお支払いが必要です。お気に入りに追加することはできますが、許可を申請して作者が許可した後でなければ使用することはできません。 詳細については RobotBTC にお問い合わせいただくか、以下の作者の指示に従ってください。
スクリプトの動作を理解していて作者も100%信頼できるということでなければ、TradingViewとしてはお金を払ってまでスクリプトを利用するのはお勧めしません。そのかわりに、コミュニティスクリプトでオープンソースの優れたスクリプトが無料で見つけられることが多々あります。
作者の指示
″Discord:BTC_BOT#8241
twitter:https://twitter.com/dashixiongbtc
微信:firstocean
チャートでこのスクリプトを利用したいですか?
注: アクセス権をリクエストされる前にこちらをご覧ください。
免責事項
これらの情報および投稿は、TradingViewが提供または保証する金融、投資、取引、またはその他の種類のアドバイスや推奨を意図したものではなく、またそのようなものでもありません。詳しくは利用規約をご覧ください。