INVITE-ONLY SCRIPT
更新済 TwP: Financials on Charts
With this indicator, you can see the following on a chart:
> An Info Panel, with the financial snapshot of the company, such as its market capitalization, annual & quarterly financials, Y/Y growth numbers, profitability margins, RoE & RoCE, and valuation ratios.
> EBITDA and PAT margins over a period of time.
> RoE and RoCE ratios over a period of time.
> Valuation multiples over a period of time.
> A comparison of margins, return ratios, and valuation multiples with any peer-group company.
Info Panel
This gives a quick snapshot of the financials of the company, which includes annual & quarterly Revenue, EBITDA, PAT, margins with Y/Y changes, Debt-Equity ratio, ROE, ROCE, and valuation multiples.

Profitability & Return Ratios
You can view quarterly as well as annual EBITDA & PAT margins and annual RoE, RoCE. You can choose to see these ratios either only for the company or can also add a peer company to compare.

Valuation Ratios
You can view TTM valuation ratios such as EV/Sales, EV/EBITDA, P/BV & P/E multiples. You can choose to see these valuation multiples either only for the company or can also add a peer company to compare.


> An Info Panel, with the financial snapshot of the company, such as its market capitalization, annual & quarterly financials, Y/Y growth numbers, profitability margins, RoE & RoCE, and valuation ratios.
> EBITDA and PAT margins over a period of time.
> RoE and RoCE ratios over a period of time.
> Valuation multiples over a period of time.
> A comparison of margins, return ratios, and valuation multiples with any peer-group company.
Info Panel
This gives a quick snapshot of the financials of the company, which includes annual & quarterly Revenue, EBITDA, PAT, margins with Y/Y changes, Debt-Equity ratio, ROE, ROCE, and valuation multiples.
Profitability & Return Ratios
You can view quarterly as well as annual EBITDA & PAT margins and annual RoE, RoCE. You can choose to see these ratios either only for the company or can also add a peer company to compare.
Valuation Ratios
You can view TTM valuation ratios such as EV/Sales, EV/EBITDA, P/BV & P/E multiples. You can choose to see these valuation multiples either only for the company or can also add a peer company to compare.
リリースノート
- Added option to see chart for certain line items (Revenue, EBITDA and PAT) on Annual & Quarterly basis.
*Added a Note in the Settings box to clarify that Line items can be seen on annual & quarterly basis; Under Ratios, Profit margins can be seen on annual & quarterly basis; RoE and ROCE are on the basis of last Financial Year; and Valuation Ratios are on Trailing Twelve Months (TTM) basis.
リリースノート
- EBITDA and PAT margins can now be seen separately.- ROE and ROCE also can now be seen separately.
- Changed the default colors for better peer company comparison.
- Removed unwanted code.
リリースノート
Added change in Quarterly Sales and EPS data.リリースノート
Corrected a silly error.リリースノート
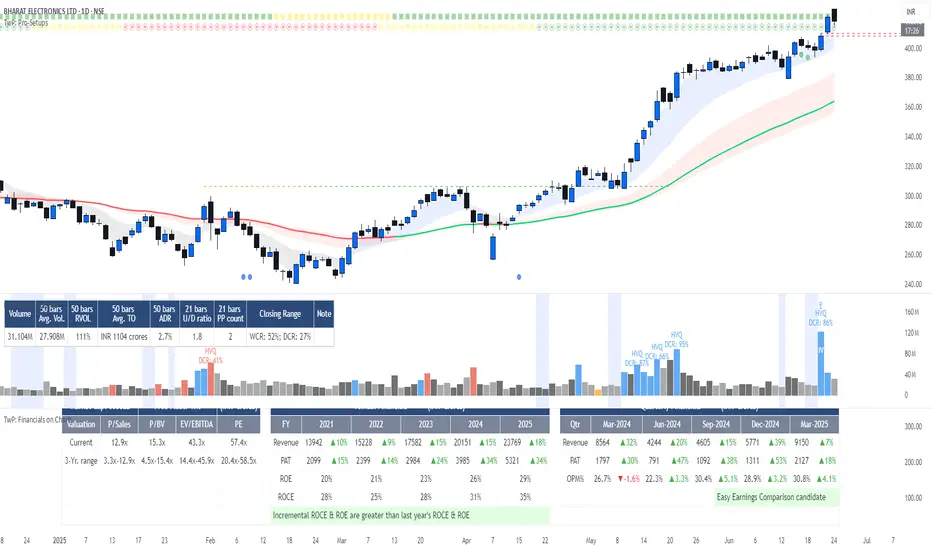
This script needed modification since the introduction of Tables in Pinescript. Hence, revamped the whole script.There are three tables that get printed on your chart:
• Table 1: This gives you information on the market cap, free float, current valuation and 3-year valuation range.
• Table 2: Annual financial numbers.
• Table 3: Quarterly financial numbers.
Plus, Table 3 also tells you if the company has accelerated sales and earnings in last two-three quarters, or is meeting Code 33 condition as laid out by Mark Minervini.
From the settings tab, you can:
- Change the scale for the financial numbers (Billion, Million, Crores, Lakhs, None).
- Adjust the size of the tables to fit in your chart.
- Change the color of the table and text.
リリースノート
Fixed a minor bug related to the note on sales & earnings acceleration.リリースノート
Added tiny, small and auto size options to fix the resolution issue.リリースノート
Option to see Key Notes instead of FinancialsThis update is useful for those who are not interested in looking at the whole financial table, but still want to know the company's performance and potential such as Accelerated Earnings, Code 33 or Easy Earnings Comparison.
From the Settings, you can choose to see only the Key Notes, instead of the Financials Summary. This will only print Key Notes, if any, like in the chart below:
You can move up the Key Notes part to the Pro-Setups or Volume Script too.
リリースノート
Added option to place Key Notes to any corner of the layout.リリースノート
Small bug related to the first Quarter name is now corrected.リリースノート
Added note for cases where Incremental ROCE or ROE is greater than ROCE or ROE of previous year. Incremental ROCE or ROE higher than last year's ROCE or ROE suggests the company is generating better returns on its new investments or equity, indicating improved capital allocation efficiency and stronger profitability from recent growth initiatives. You can see the same explanation as a tooltip as well.Where previous year's financials were not available, the table used to show '1970' as the year. This has been corrected and the table header in such cases will show blank now.
招待専用スクリプト
こちらのスクリプトにアクセスできるのは投稿者が承認したユーザーだけです。投稿者にリクエストして使用許可を得る必要があります。通常の場合、支払い後に許可されます。詳細については、以下、作者の指示をお読みになるか、Pro-Setupsに直接ご連絡ください。
スクリプトの機能を理解し、その作者を全面的に信頼しているのでなければ、お金を支払ってまでそのスクリプトを利用することをTradingViewとしては「非推奨」としています。コミュニティスクリプトの中で、その代わりとなる無料かつオープンソースのスクリプトを見つけられる可能性もあります。
作者の指示
Please visit our website for getting access to the script.
警告: 招待専用スクリプトへのアクセスをリクエストする前に弊社のガイドをお読みください。
Pro-Setups is meant for Swing and Positional Trading. It is a combination of scripts on TradingView, and a screener Dashboard on web. Whatever you scan on Dashboard, you can see the same on your charts.
For details, please visit pro-setups.com
For details, please visit pro-setups.com
免責事項
これらの情報および投稿は、TradingViewが提供または保証する金融、投資、取引、またはその他の種類のアドバイスや推奨を意図したものではなく、またそのようなものでもありません。詳しくは利用規約をご覧ください。