OPEN-SOURCE SCRIPT
[QG] Dynamic Zones Value Chart
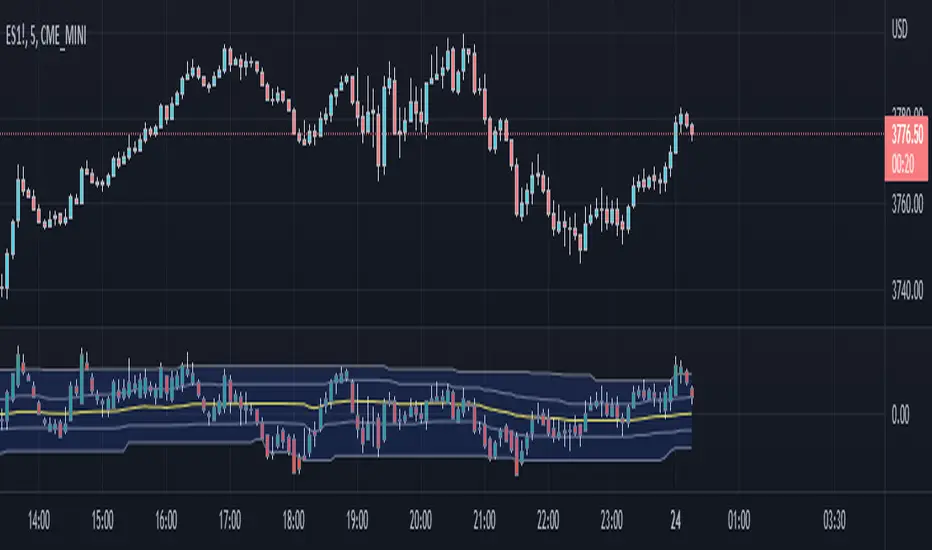
The classic value charts indicator has fixed overbought and oversold levels at 8 and 10 levels and the idea of adding dynamic zones around them instead of fixed levels is appealing.
During the strong trending movements, the overbought and oversold levels also dynamically move up or down.
I have used the dynamic zones code by @allanster.
The idea of using dynamic zones on value charts comes from a similar indicator available in mql4.
During the strong trending movements, the overbought and oversold levels also dynamically move up or down.
I have used the dynamic zones code by @allanster.
The idea of using dynamic zones on value charts comes from a similar indicator available in mql4.
オープンソーススクリプト
TradingViewの精神に則り、このスクリプトの作者はコードをオープンソースとして公開してくれました。トレーダーが内容を確認・検証できるようにという配慮です。作者に拍手を送りましょう!無料で利用できますが、コードの再公開はハウスルールに従う必要があります。
免責事項
この情報および投稿は、TradingViewが提供または推奨する金融、投資、トレード、その他のアドバイスや推奨を意図するものではなく、それらを構成するものでもありません。詳細は利用規約をご覧ください。
オープンソーススクリプト
TradingViewの精神に則り、このスクリプトの作者はコードをオープンソースとして公開してくれました。トレーダーが内容を確認・検証できるようにという配慮です。作者に拍手を送りましょう!無料で利用できますが、コードの再公開はハウスルールに従う必要があります。
免責事項
この情報および投稿は、TradingViewが提供または推奨する金融、投資、トレード、その他のアドバイスや推奨を意図するものではなく、それらを構成するものでもありません。詳細は利用規約をご覧ください。