OPEN-SOURCE SCRIPT
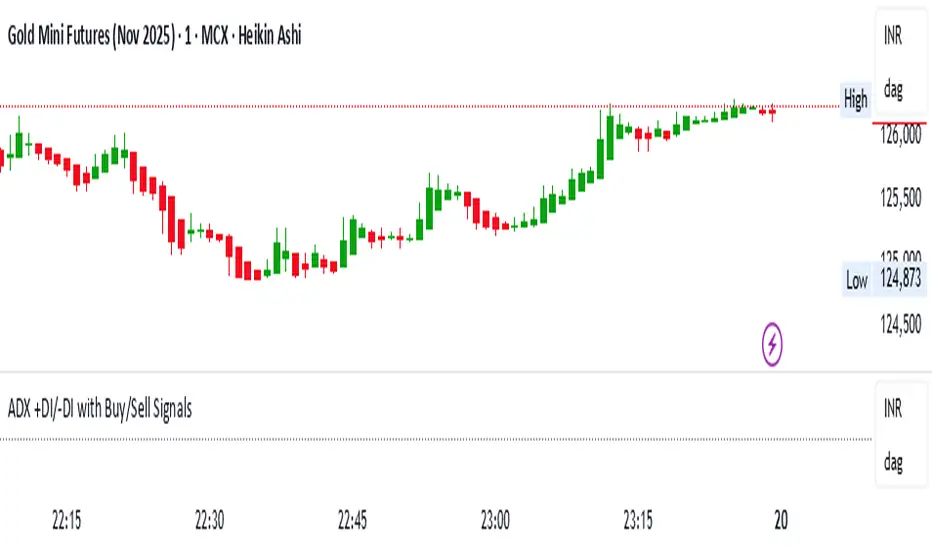
ADX +DI/-DI with Buy/Sell Signals
//version=5
indicator("ADX +DI/-DI with Buy/Sell Signals", overlay=true)
// Inputs
adxLength = input.int(14, "ADX Length")
threshold = input.float(25.0, "ADX Threshold")
// Directional Movement
upMove = ta.change(high)
downMove = -ta.change(low)
plusDM = (upMove > downMove and upMove > 0) ? upMove : 0.0
minusDM = (downMove > upMove and downMove > 0) ? downMove : 0.0
// True Range and Smoothed Values
tr = ta.rma(ta.tr, adxLength)
plusDI = 100 * ta.rma(plusDM, adxLength) / tr
minusDI = 100 * ta.rma(minusDM, adxLength) / tr
dx = 100 * math.abs(plusDI - minusDI) / (plusDI + minusDI)
adx = ta.rma(dx, adxLength)
// Buy/Sell Conditions
buySignal = ta.crossover(plusDI, minusDI) and adx > threshold
sellSignal = ta.crossover(minusDI, plusDI) and adx > threshold
// Plot Buy/Sell markers
plotshape(buySignal, title="BUY", location=location.belowbar,
color=color.new(color.lime, 0), style=shape.triangleup, size=size.large, text="BUY")
plotshape(sellSignal, title="SELL", location=location.abovebar,
color=color.new(color.red, 0), style=shape.triangledown, size=size.large, text="SELL")
// Optional ADX + DI lines (hidden by default)
plot(adx, title="ADX", color=color.yellow, linewidth=2, display=display.none)
plot(plusDI, title="+DI", color=color.green, display=display.none)
plot(minusDI, title="-DI", color=color.red, display=display.none)
hline(threshold, "ADX Threshold", color=color.gray, linestyle=hline.style_dotted)
// Alerts
alertcondition(buySignal, title="BUY Alert", message="ADX Buy Signal Triggered")
alertcondition(sellSignal, title="SELL Alert", message="ADX Sell Signal Triggered")
オープンソーススクリプト
TradingViewの精神に則り、この作者はスクリプトのソースコードを公開しているので、その内容を理解し検証することができます。作者に感謝です!無料でお使いいただけますが、このコードを投稿に再利用する際にはハウスルールに従うものとします。
免責事項
これらの情報および投稿は、TradingViewが提供または保証する金融、投資、取引、またはその他の種類のアドバイスや推奨を意図したものではなく、またそのようなものでもありません。詳しくは利用規約をご覧ください。
オープンソーススクリプト
TradingViewの精神に則り、この作者はスクリプトのソースコードを公開しているので、その内容を理解し検証することができます。作者に感謝です!無料でお使いいただけますが、このコードを投稿に再利用する際にはハウスルールに従うものとします。
免責事項
これらの情報および投稿は、TradingViewが提供または保証する金融、投資、取引、またはその他の種類のアドバイスや推奨を意図したものではなく、またそのようなものでもありません。詳しくは利用規約をご覧ください。