INVITE-ONLY SCRIPT
Killstats
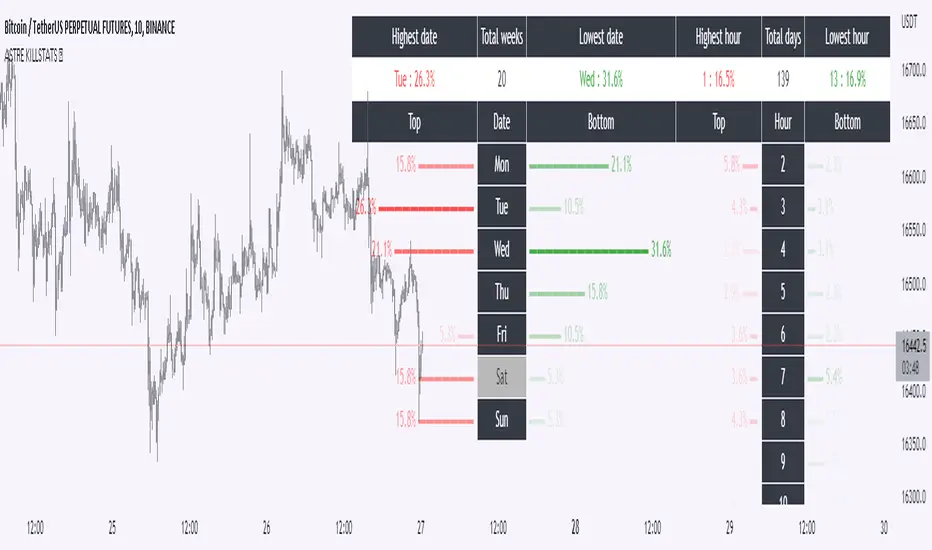
Backtest and identify at what times/days the high/low were formed. The periods are shown on the graph along with detailed statistics.
Exemple with "days : 600" and "13h : top 12%" : we understand that over 600 days, in 12% of the cases we have formed the top of the day at 13h.
up to 1000+ days studied to find favorable reversal time slots: killstats! The data presented can sometimes be... surprising.
Increasing/decreasing the timeframe on chart = increase/decrease the studied period.
A period of 1000 days ( UT : h1) allows to have solid but not exact statistics.
A period of 30 days allows to have current statistics but too little sample to know if the data is relevant.
I recommend looking for intersections of killstats over several periods: If over 1000 days AND 30 days, 3pm was a time with a high probability of forming a top, it is interesting to look for short positions between 3pm and 4pm.
The data is displayed in the form of a diagram whose visual allows to identify effective time slots.
Caution. Timeframe: h1 maximum for the study of the day's high/low to be correct - and daily maximum for the study of the week's high/low.
Caution2. Match the timezone with the input (by default set to GMT+1). So if you are at GMT+2, you must put "2" in timezone.
I recommend using this as part of an aggressive high frequency scalping strategy to make the most of your trading session - with the aim of quickly moving to TP1/BE and leaving your winning position open.
招待専用スクリプト
このスクリプトは作者が承認したユーザーのみアクセス可能です。使用するにはアクセス申請をして許可を得る必要があります。通常は支払い後に承認されます。詳細は下記の作者の指示に従うか、astre_tsに直接お問い合わせください。
TradingViewは、作者を完全に信頼し、スクリプトの動作を理解していない限り、有料スクリプトの購入・使用を推奨しません。コミュニティスクリプトには無料のオープンソースの代替が多数あります。
作者の指示
Contact me at @astre_ts on telegram or TradingView for free trials
Most aggressive TradingView/MT4/MT5 trading setup on the market. Pure juice concentrated from SMC/ICT, divergences and PA!
Snipe the institutional levels! 🐋🏹
Snipe the institutional levels! 🐋🏹
免責事項
この情報および投稿は、TradingViewが提供または推奨する金融、投資、トレード、その他のアドバイスや推奨を意図するものではなく、それらを構成するものでもありません。詳細は利用規約をご覧ください。